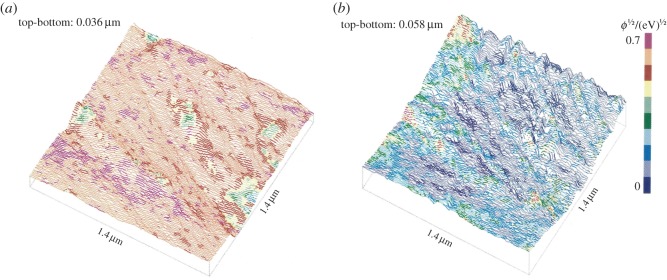
Figure 5.

The same element of the surface of a W specimen recorded with a W tip (a) when submerged in water, and (b) subsequently in air. Note the smoothness of the surface recorded in water compared with that in air. Scanned area: 1400 × 1400 nm. Colours indicate tunnelling barrier height. (Reproduced with permission from [25]. Copyright © Elsevier.) (Online version in colour.)
