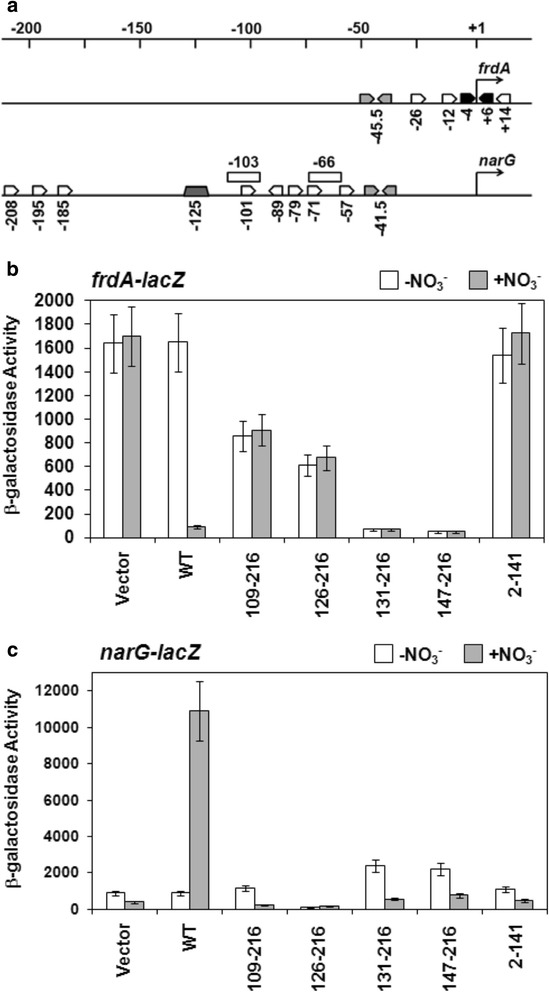
Fig. 2.

The ability of the NarL protein constructs to repress frdA-lacZ or activate narG-lacZ. (a) Transcription factor binding sites along the frdA and narG promoters. Black inverted arrows represent NarL high-affinity, 7-2-7 binding arrangements; white arrows represent NarL non-7-2-7 sites or NarL single heptameric sites; light gray inverted arrows represent FNR sites, a dark gray trapezoid represents the IHF binding site; white rectangular boxes represent FIS binding sites. The scale denotes nucleotides, and an arrow at the +1 nucleotide represents the transcription start site. Information used to generate this image was taken from the EcoCyc database [52] and references therein. (b) The ability of the NarL proteins to repress frdA-lacZ expression, or (c) to activate narG-lacZ expression. NarL truncated proteins were tested for anaerobic in vivo activity: the indicated lacZ transcriptional reporter fusions were used in E. coli MC4100 strains (ΔnarX/L/Q) harboring pACYC184 plasmid derivatives that contained NarX and either NarL+ or the indicated truncated NarL derivative. Levels of activity are measured in nmol OMPG hydrolyzed per min per mg protein. White bars indicate activity in the absence of nitrate, gray bars indicate activity in the presence of nitrate. Vector refers to parent plasmid pACYC184 run as a control. Error bars (vertical lines) represent one standard deviation, based on the mean value for at least three repeat experiments
