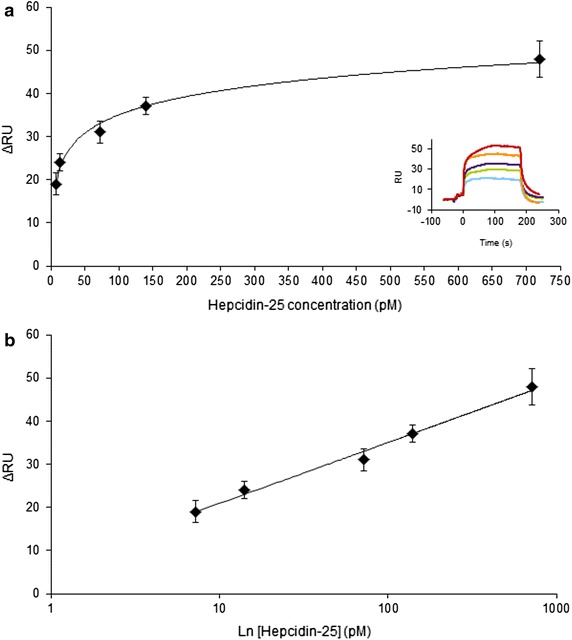
Fig. 5.

MIP NP SPR sensor response to Hepcidin-25. a Hepcidin-25 was injected at 7.2 pM (light blue curve), 14 pM (green curve), 72 pM (violet curve), 140 pM (orange curve) and 720 pM (red curve). The signal was recorded over timed and plotted as response units (RU). The sensorgrams of the MIP-NP-sensor response for Hepcidin-25 are shown in the inset. b Hepcidin-25 showed a log-linear response in the range 7.2–720 pM. A calibration curve was thus built for Hepcidin-25 by plotting the logarithm of the concentration vs ΔRU (Response Unit): the linear fit equation was f(x) = 6.07 ln(x) + 7.03 and the R2 was 0.98
