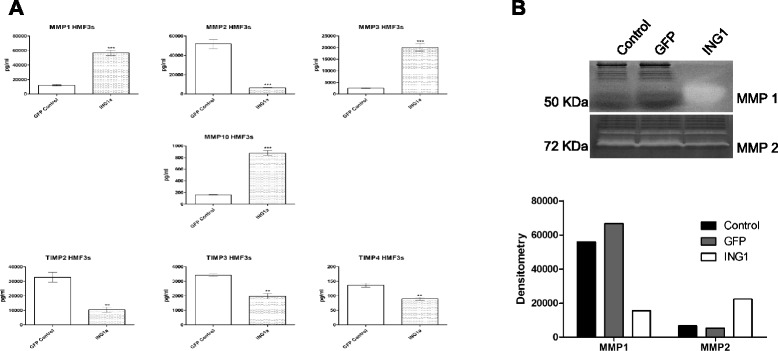
Fig. 4.

MMPs/TIMPs regulated by ING1a in HMF3s cells. a Levels of MMPs and TIMPs upon ING1a overexpression in HMF3s cells (n = 3; ** p < 0.001; *** p < 0.0001). b Zymographs depicting caseinolytic and gelatinolytic activity of MMP-1 and MMP-2 respectively in HMF3s cells. The bottom panel shows densitometric analysis of zymographs
