
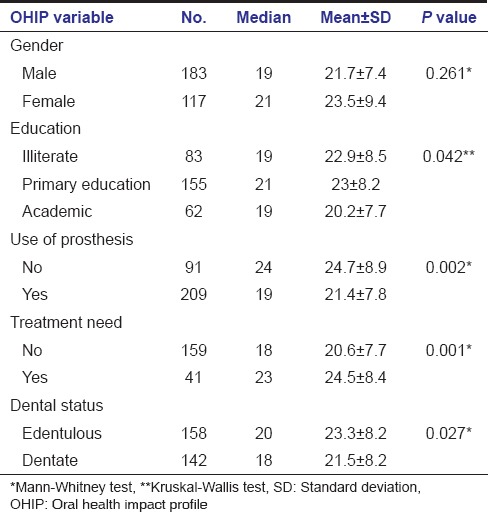
Table 2.
Means and standard deviations of OHIP-14 scores in the study population separately in terms of demographic variables
Official websites use .gov
A
.gov website belongs to an official
government organization in the United States.
Secure .gov websites use HTTPS
A lock (
) or https:// means you've safely
connected to the .gov website. Share sensitive
information only on official, secure websites.
Means and standard deviations of OHIP-14 scores in the study population separately in terms of demographic variables