Figure 3.

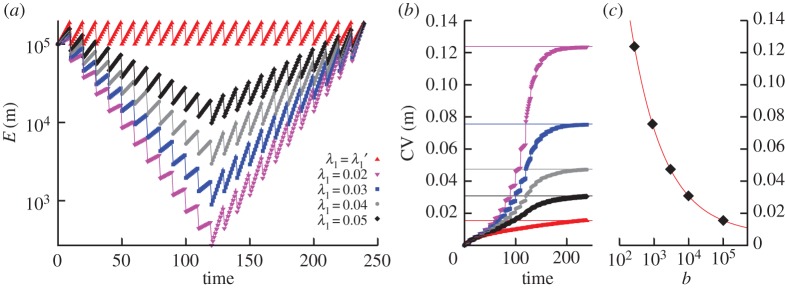
Modelling copy number variability due to mtDNA bottlenecking. (a) Trajectories of mean copy number of cellular agents born with rate λ1 (t<120) and (t≥120). Lower λ1 values enforce a smaller copy number bottleneck, with copy number recovering to its initial value after the bottleneck. is the value required to maintain a constant-mean copy number between cell divisions. Lines are analytic results; points are stochastic simulations. (b) Trajectories of coefficient of variation (CV) as different bottleneck sizes are imposed on the system. Horizontal lines give the analytic predictions for final CV derived from equation (3.5). Other lines are analytic results; points are stochastic simulations. (c) CV as a function of bottleneck size from equation (3.5); points show specific instances of stochastic simulation.
