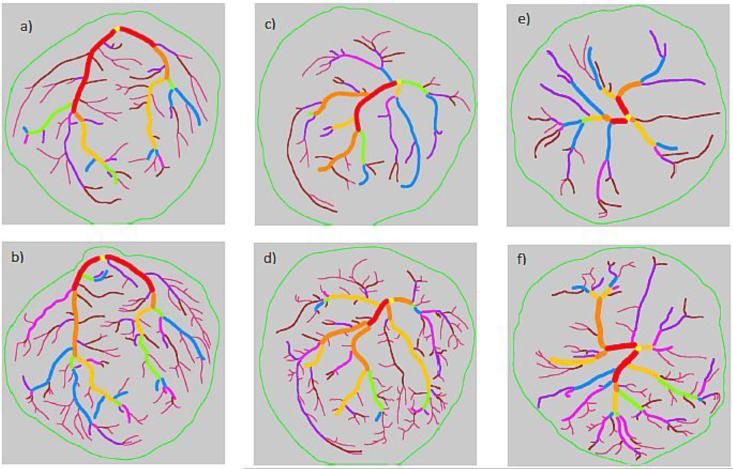
Figure 2. Illustrations of the performance of shape matching algorithm.
The top row (Figures a, c and e) are tracings of uninjected placentas and the bottom row (Figures b, d and e) are their injected counterparts. Figures a) and b) represent an ideal pair that was most frequently matched by the algorithm with minimum error. Figures c) and d) represent an average pair of tracings that was matched by the algorithm with some error. Figures e) and f) represent a pair of tracings that the algorithm found difficult to match.

