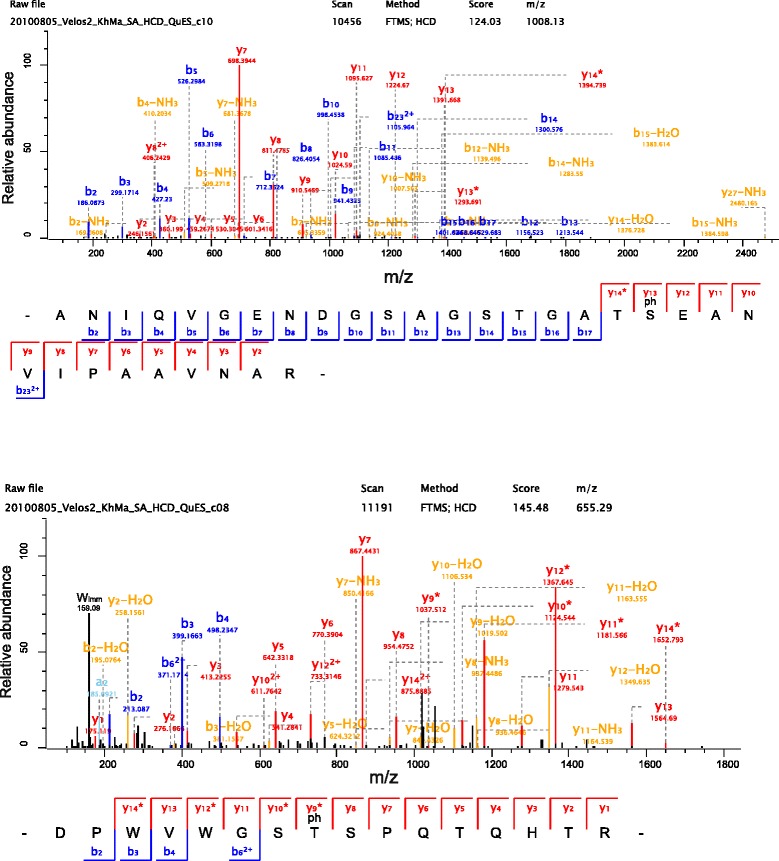
Fig. 7.

Representative spectra of ovocleidin-116 phosphopeptides. HCD spectra of two selected ovocleidin-116 phosphopeptides (compare Table 2). Y-ions are shown in red, b-ions in blue, and water or ammonia losses in orange. *indicates loss of H3PO4 from a phosphorylated amino acid. Such losses can occur only C-terminal to the phosphorylated amino acid. In both spectra y7 is the most intense ion, due to the frequently observed preferential cleavage N-terminal to a proline. A tryptophane immonium ion (m/z 159.0922) in the lower spectrum is labeled Wimm
