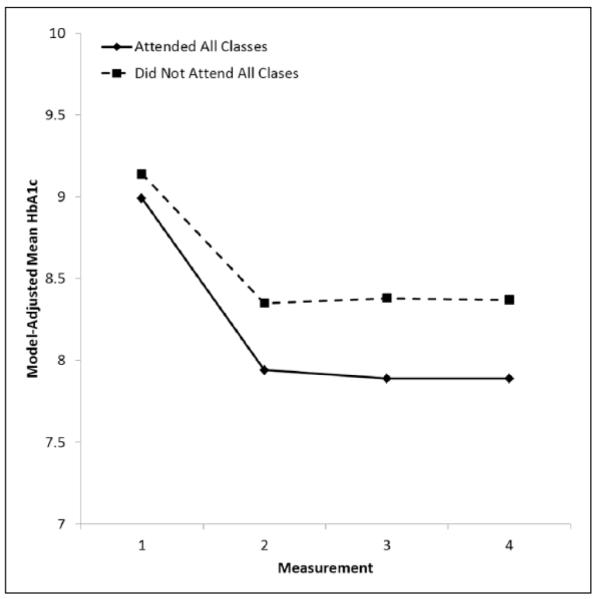
FIGURE 2. Model-Adjusted Mean HbA1C Values, by Measurement Order and Attending All Program Classes: Alliance to Reduce Disparities in Diabetes Program Participants Only.

NOTE: HbA1c = hemoglobin A1c .Means adjusted for site, age, gender, measurement order, class attendance, and interaction between measurement order and class attendance. Changes in HbA1c values over time differed significantly across patients, depending on class attendance: class attendance × measurement order: Wald χ2(3) = 9.93, p = .019.
