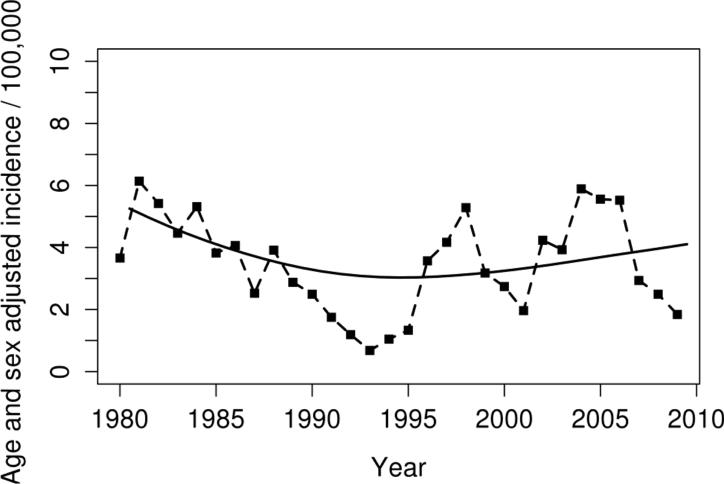
Figure 1.
Age- and sex- adjusted (to US white 2000 population) incidence rates of ankylosing spondylitis in 1980-2009 using New York criteria according to calendar year. Points plotted represent 3 year moving averages. The solid line represents the non-linear trend, which was estimated using smoothing splines.

