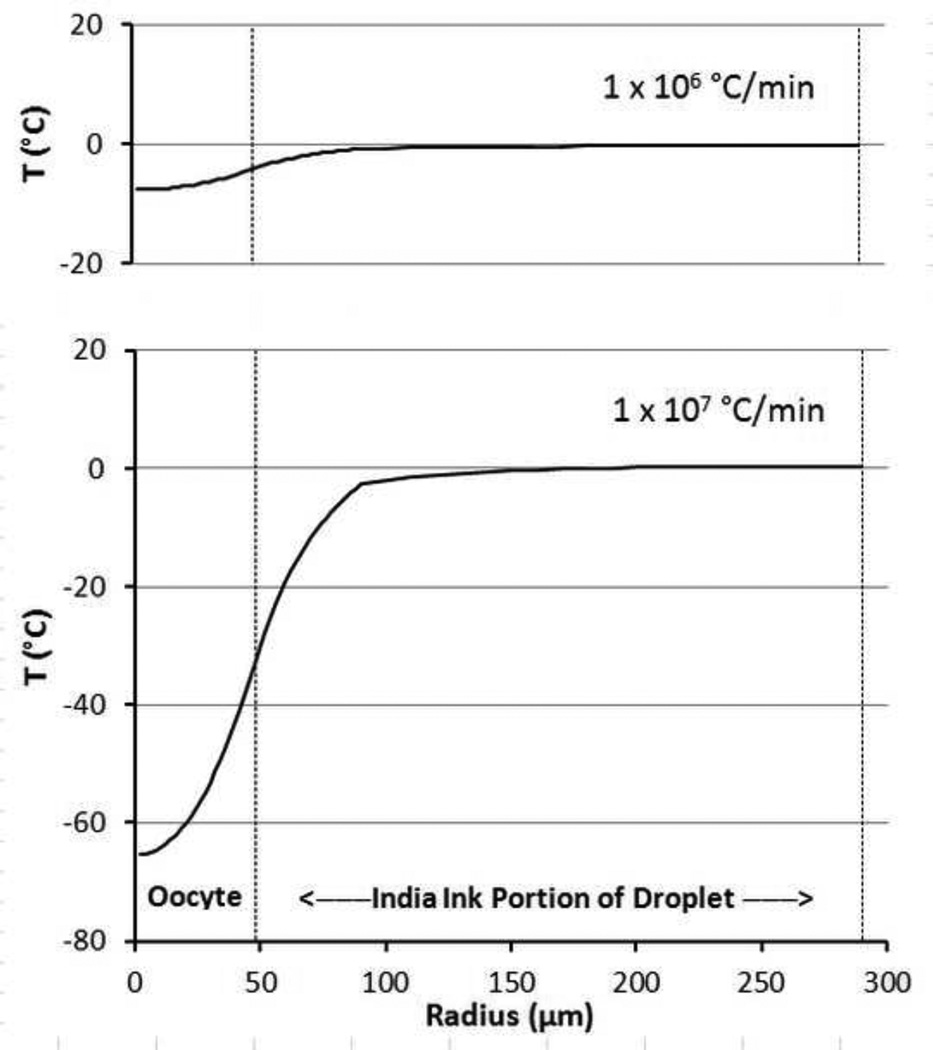
Fig 6.
Modeled temperature response vs radius of an oocyte and surrounding India ink shell at the end of a laser pulse yielding warming rates of 1× 10⁶ and 1 × 10⁷ °C/min. The radius is measured from the center of the oocyte to the edge of the droplet at 290 um. The outer edge of the zona pellucida at 48 um is denoted by the vertical dotted line and marks the division between the inner, ink free region and outer ink containing region which absorbs the laser IR energy.

