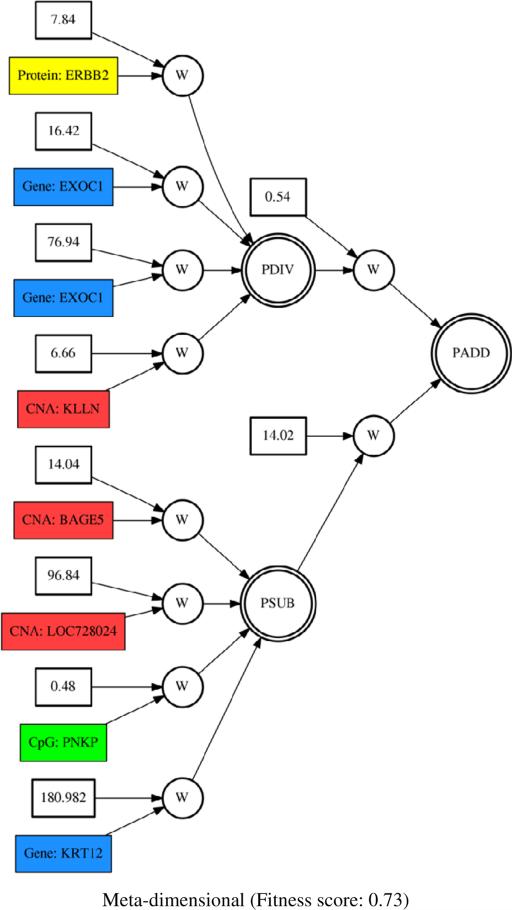
Figure 4.
Meta-dimensional model with genomic features from CNA, methylation, gene expression, and protein expression data. Red, green, blue, and yellow boxes represent CNA, methylation, gene expression, and protein features, respectively. PADD, PDIV, and PSUB are an addition, division, and subtraction activation node, respectively.

