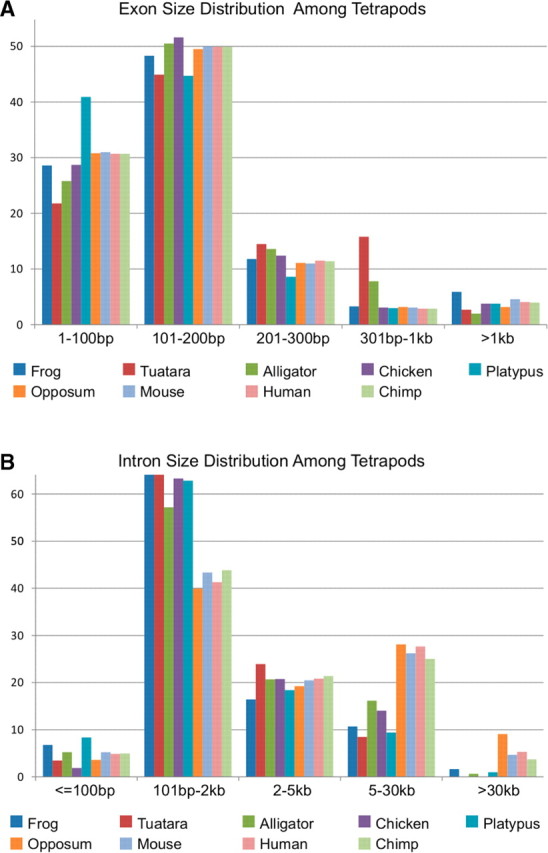
Fig. 3.

Summary of (A) exons and (B) introns across amniotes in different size classes as a percentage of all exons and introns, respectively. The dataset is composed of coding exons and introns. However, it excludes promoters, and 5′ and 3′ UTR Exons. Genscan estimates of tuatara and alligator are not based on data on sequences of whole genomes and likely underestimate the percentage of elements within the largest class due to the manner in which the BAC-end sequences were sampled. However, at least 80% of the data comes from BACs containing homologous regions in both reptiles. Species are arranged in the histogram in the same order as in the symbol legend.
