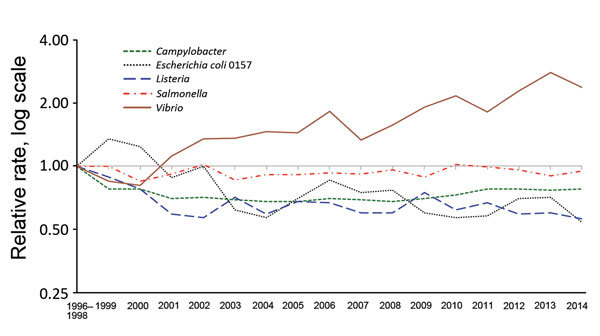
Figure 2.

Relative rates of culture-confirmed infections with Campylobacter, Escherichia coli O157, Listeria, Salmonella, Vibrio, and Yersinia compared with 1996–1998 rates, Foodborne Diseases Active Surveillance Network, United States, 1996–2014. The position of each line indicates the relative change in the incidence of that pathogen compared with 1996–1998. The actual incidences of these infections cannot be determined from this graph. Data for 2014 are preliminary.
