
Figure 5.
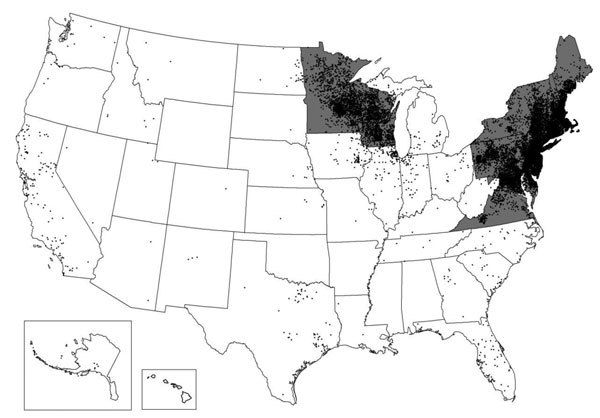
Comparison of states and district with highest incidence per 100,000 persons of Lyme disease in MarketScan (gray fill) and US surveillance (black dots), 2005–2010. Each dot is placed randomly within the county of residence for each confirmed Lyme disease case reported through surveillance during 2010.