
Figure 1.
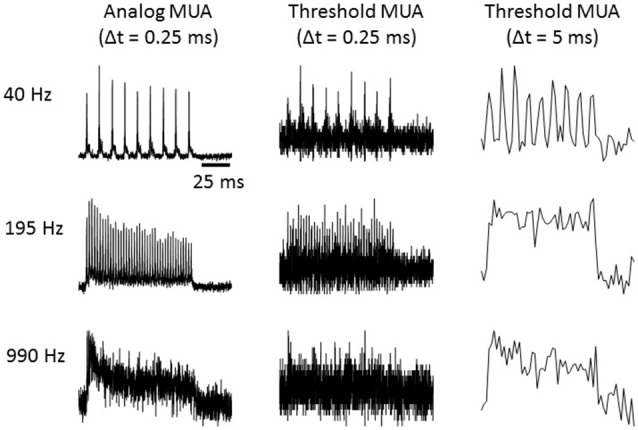
Multi-unit responses quantified using either the “analog multi-unit activity (MUA)” method, or by counting threshold crossings with time bins as indicated. Responses to click trains presented at the click rates indicated to the left are shown. Each trace is the average response over 40 trials.