
Figure 11.
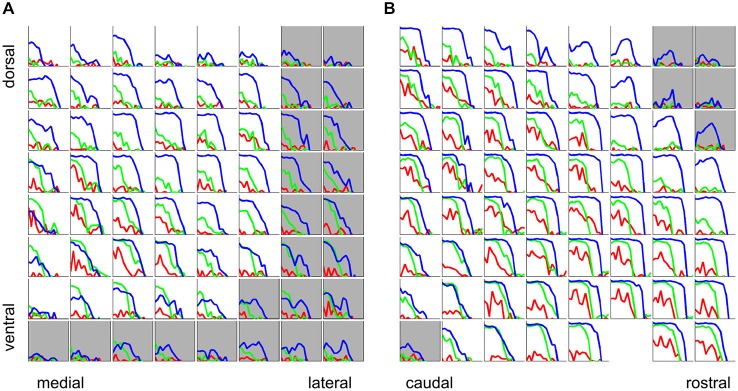
Phase-locking to the stimulus period for click trains (blue), SAMN (green), and IRN (red) for the same two sample electrode penetrations for which rate tuning curves were shown in Figure 6, one oriented medio-laterally (A), the other oriented rostro-caudally (B). Each colored curve shows the phase-locking coefficient as a function of stimulus MF. Tuning curves from recording sites inside the ICc are plotted against a white background, those outside the ICc are shown against a light gray background. Axis labels were omitted as they would be too small or too crowded to see, but all axes are scaled identically to Figure 5C, i.e., the abscissas cover a range of [−4,1] octaves re 500 Hz and the ordinates cover a range of [0, 1].