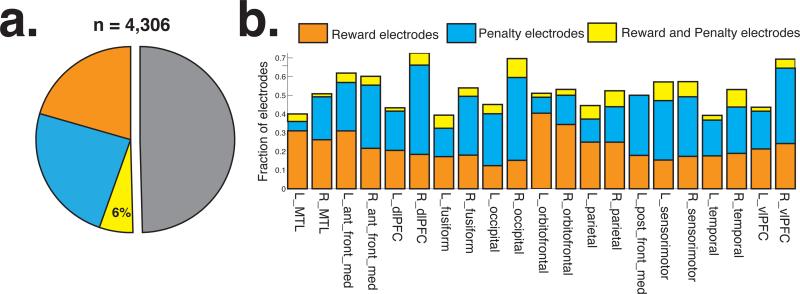
Figure 2. Anatomical distribution of positive and negative outcome signals.
a. Fraction of reward (orange) and penalty (blue) electrodes among all recorded electrodes b. Fraction of positive and negative electrodes in each ROI. See Table 2 for statistics.

