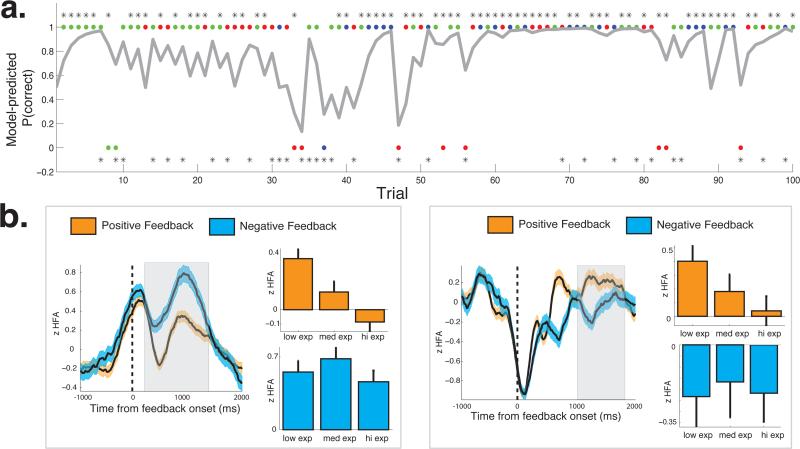
Figure 3. Relating neural activity to reward expectation.
a. Behavioral data from one example session. On the top of the figure, dots indicate when the subject chose the high-probability item. Color of the dots indicate the item pair that was presented (blue -80/20, green - 70/30, red - 60/40). Asterisks indicates when positive feedback was provided following each choice. Bottom of the figure, dots indicate when the subject chose the low-probability item (same color scheme as a), whereas asterisks indicate when negative feedback was provided following each choice. Grey line indicates model-predictions of subjects’ choices. b. Two example valence-encoding electrodes recorded from this subject that showed expectation-related changes in activity. Mean HFA response following positive (orange) and negative (blue) outcomes. Width indicates s.e.m. across trials. Shaded box indicates the time during which we observed significant valence-related HFA differences based on our cluster-based permutation procedure. During this time interval, we studied post-reward and post-penalty changes in HFA during terciles of reward expectation using a regression framework (see main text).

