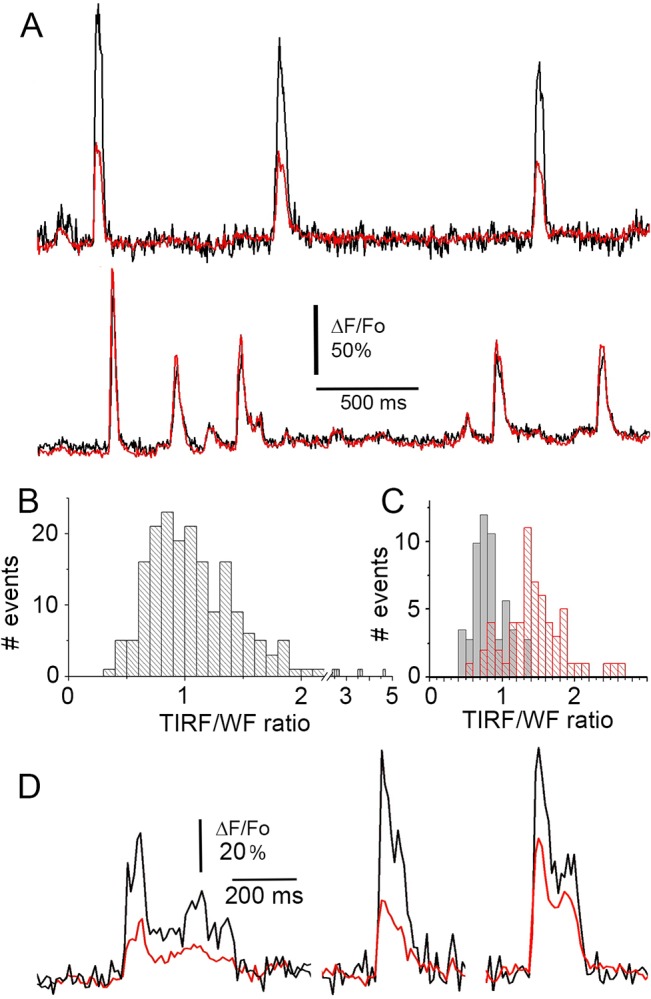
Fig 5. Interleaved imaging of Ca2+ puffs in TIRF and in wide-field modes.

(A) Fluorescence recordings from two puff sites, where Ca2+ release originated close to the plasma membrane (top) and deeper into the cell (bottom). Each record shows fluorescence monitored in TIRF mode (black) and WF mode (red). Alternate 5ms exposures were made in each mode, and fluorescence measurements were made from 3x3 pixel (~1 x 1 μm) regions of interest centered identically over the puff site on the two de-interlaced image sequences. (B) Distribution of puff amplitude ratios as measured in TIRF and WF modes. A ratio >1 indicates that a puff gave a larger signal in TIRF than in WF mode; and vice versa for ratios <1. Data are from 189 events at sites that gave ≥4 puffs, in 14 SH-SY5Y cells. (C) Puff amplitude ratios (TIRF/WF) segregated by sites which showed mean ratios >1.1 (red) and <0.9 (black). (D) Examples of ‘superficial’ puffs imaged in interleaved TIRF (black) and WF (red) modes, shown on an expanded timescale to illustrate the improved kinetic resolution of TIRF imaging.
