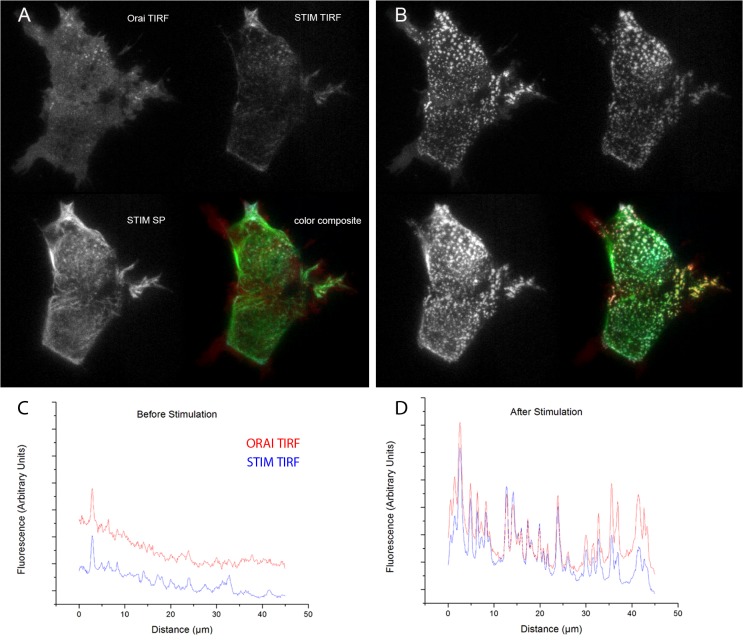
Fig 6. Multi-mode imaging of STIM/Orai relocalization.
Images in each panel show EGFP-tagged Orai visualized by shadowless TIRF excitation at 488 nm (top left); mCherry-tagged STIM visualized by TIRF excitation at 532 nm (top right); mCherry-tagged STIM visualized by skimming- plane (SP) excitation at 532 nm (bottom left); and a pseudocolored overlay (Orai in green, TIRF-STIM in red, SP-STIM in blue) of these three images. Images were acquired before (A) and about 3 min after (B) addition of thapsigargin to deplete ER Ca2+ stores and induce relocalization and clustering of Orai and STIM. Each image (81 x 61 μm) is an average of two successive exposures; brightness and contrast settings were individually adjusted for each mode, but are consistent between control and thapsigargin conditions. Traces in (C) and (D) show line-scans of EGFP-Orai (red traces) and mCherry-STIM (blue traces) fluorescence in TIRF mode obtained before from 20-frame averages captured before (C) and after (D) thapsigargin treatment.

