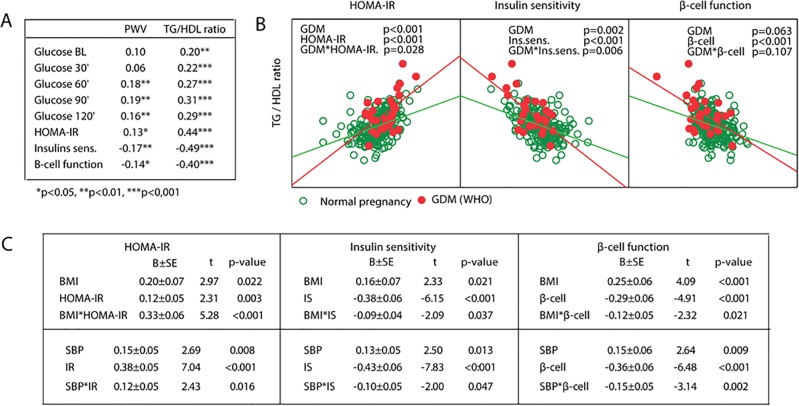
Fig 2. Relationship between measurements of glycemic control and vascular stiffness at 5-year follow-up in patients with (red circles) and without GDM (green circles) in the index pregnancy.
(A) Associations between PWV, TG/HDL-C ratio and glucose levels during OGTT, HOMA-IR, insulin sensitivity and beta-cell function in the whole cohort at follow-up. (B) Interaction analysis between GDM (red) and indices of glucose metabolism on the TG/HDL ratio. (C) Interaction analysis between BMI and SBP and indices of glucose metabolism on the TG/HDL ratio.

