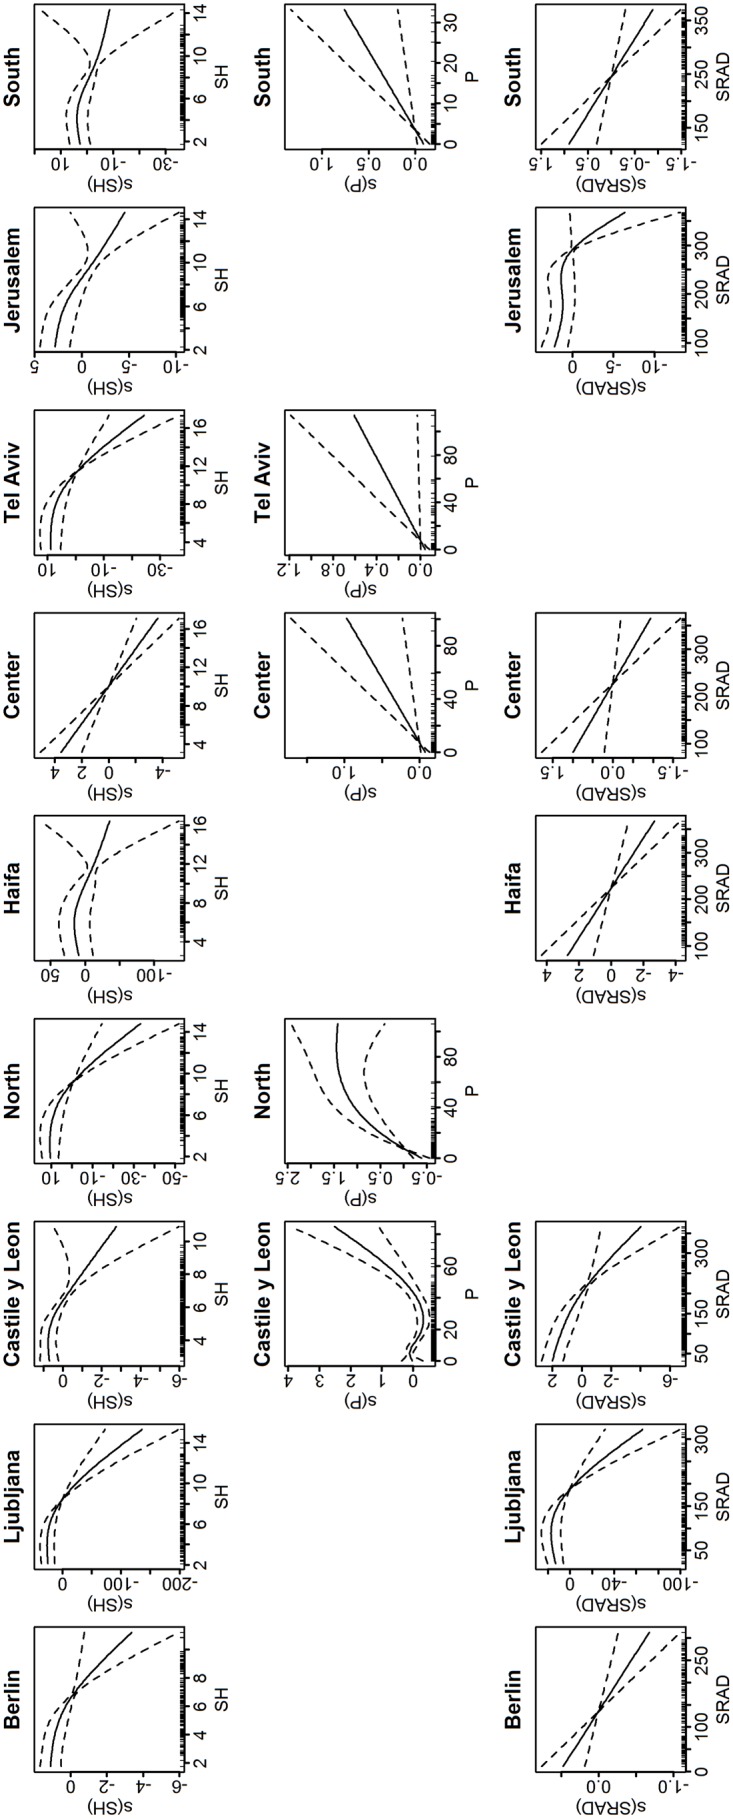
Fig 2. Plots of the meteorological smooth terms for Model 1 (with specific humidity).

Only terms that are significant are plotted. The y-axis is in the predictor scale (log(y)) and normalized, while the x-axis is the value of the meteorological variable. The dashed lines are the 95% confidence interval. Downward slope indicates inverse relationship, while upward slope indicates proportional relationship.
