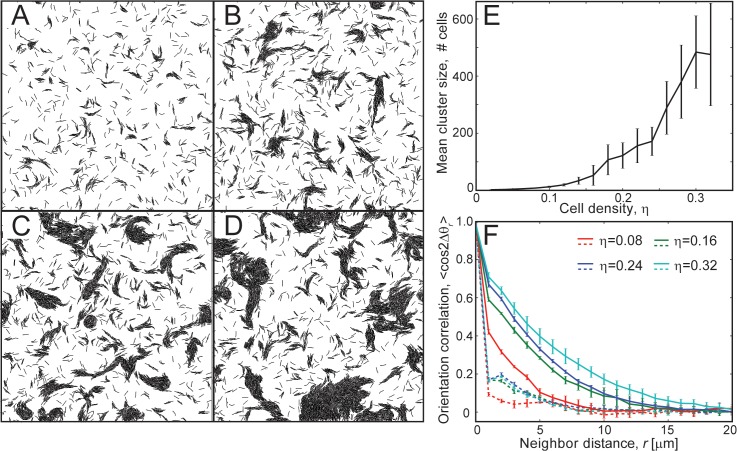
Fig 1. Clustering behavior of non-reversing flexible agents in simulations.
(A-D) Snapshots of the simulation region at 180 min of simulation time for different cell densities, η. (A) η = 0.08, (B) η = 0.16, (C) η = 0.24, (D) η = 0.32. Flexible agents formed aligned clusters at moderate to high cell densities (η ≥ 0.16). (E) Mean cluster sizes, 〈m〉, from simulation as a function of cell density, η. The error bars indicate the standard deviation in the data. The results are averaged over 5 independent simulation runs. The mean cluster sizes increased with increases in cell density. (F) Orientation correlation 〈cos 2Δθ r〉 among cells as a function of neighbor cell distance, r. Δθ r is the angle deviation between orientations (θ) of a pair of neighbor cells separated by a distance r. Orientation correlation (cos 2Δθ r) values from all cell pairs are binned based on r (bin width = 1 μm) and averaged. Dashed and solid lines represent orientation correlation values at 1 min and 180 min of simulation time, respectively. Agents in clusters showed higher neighbor alignment at larger distances compared to the initial randomly oriented cells. Furthermore, the alignment increases with increases in cell density.

