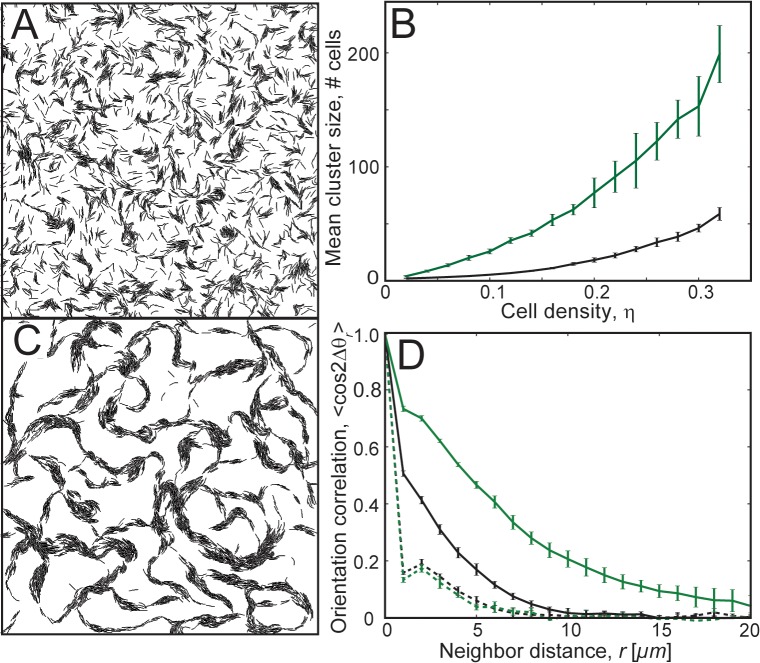
Fig 2. Clustering behavior of periodically reversing agents in simulations.
(A) Snapshot of the simulation with periodically reversing agents (η = 0.24) at 180 min of simulation time. Reversing agents did not show significant clustering. (B) Mean cluster sizes, 〈m〉, in simulation as a function of cell density, η, for agents following slime trails (green line) and agents without slime trails (black line). Agents following slime trails showed a significant increase in mean cluster size compared to agents without slime-trail-following. (C) Snapshot of the simulation for periodically reversing cells with the slime-trail-following mechanism (η = 0.24, L s = 11 μm, ε s = 1.0, refer to Methods for details) at 180 min of simulation time. Agents show improved clustering compared to those without the slime-trail-following mechanism. (D) Orientation correlation 〈cos 2Δθ r〉 among agents for reversing cells (black) and reversing cells with the slime-trail-following mechanism (green). Dashed and solid lines are orientation correlation values at 1 min and 180 min of simulation time, respectively. Orientation correlation with neighbors improved for larger neighbor distances with the slime-trail-following mechanism.

