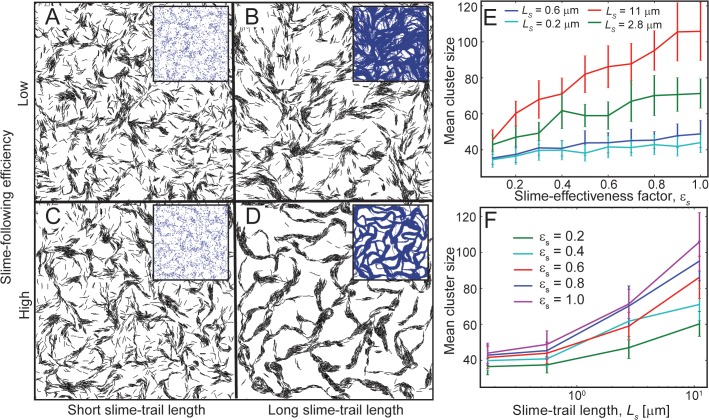
Fig 3. Robustness of the slime-trail-following mechanism for cell clustering.
(A-D) Snapshots of simulations showing agent clustering behavior (η = 0.24) for variation in the slime effectiveness value and slime trail length at 180 min of simulation time. Only agents with high slime-trail-following efficiency and long slime trails show significant clustering behavior (D). Inset figures show the slime distribution in the simulation region. The mean cluster sizes in the simulations (E) as a function of the slime effectiveness factor, ε s for different slime trail lengths and (F) as a function of the slime trail length, L s, for different slime effectiveness factor values. Cell clustering improved with increases in the slime effectiveness factor (E), provided the slime trails are sufficiently long, and with increases in the slime trail length (F).

