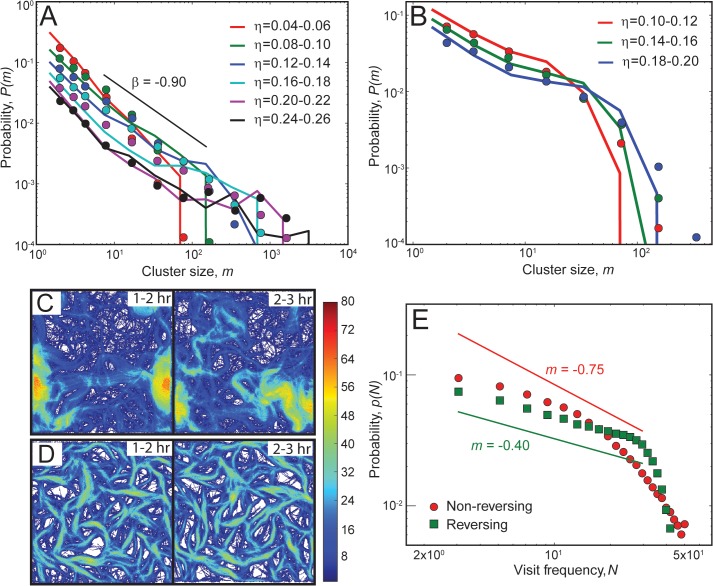
Fig 4. Comparison of cell clustering behavior in simulations with experiments.
(A-B) Comparison of cluster size distributions (CSD) from simulations (lines) with experimental data (symbols, digitized from Starruẞ et al. [16]) for non-reversing (A) and reversing (B) cells. Probability, p(m), of finding a cell in a cluster is plotted as a function of the cluster size m. We use different sets of slime-trail-following mechanism parameters for non-reversing (L s = 0.6 μm, ε s = 0.5) and reversing (L s = 11 μm, ε s = 0.2) agents. CSD results from simulations show a similar trend to that of the experimental data. (A) Non-reversing cells show a power-law-like CSD, whereas reversing cells show a monotonically decreasing CSD (B). (C-D) Heat maps of cell visit frequencies over the simulation region for 2 consecutive hours (η = 0.24). The color bar represents the number of cell visits per hour at a particular location. Non-reversing cells show a dynamic cluster pattern with changes in cell traces (C), whereas reversing cells show a static cluster pattern with the pattern of cell traces remaining approximately the same over time (D). (E) Probability of cell visits, p(N), as a function of visit frequency, N, for non-reversing (red) and reversing cells (green) over a 1-hr simulation time (120–180 min). Reversing cells show a large fraction of sites with high visit frequencies compared to non-reversing cells.

