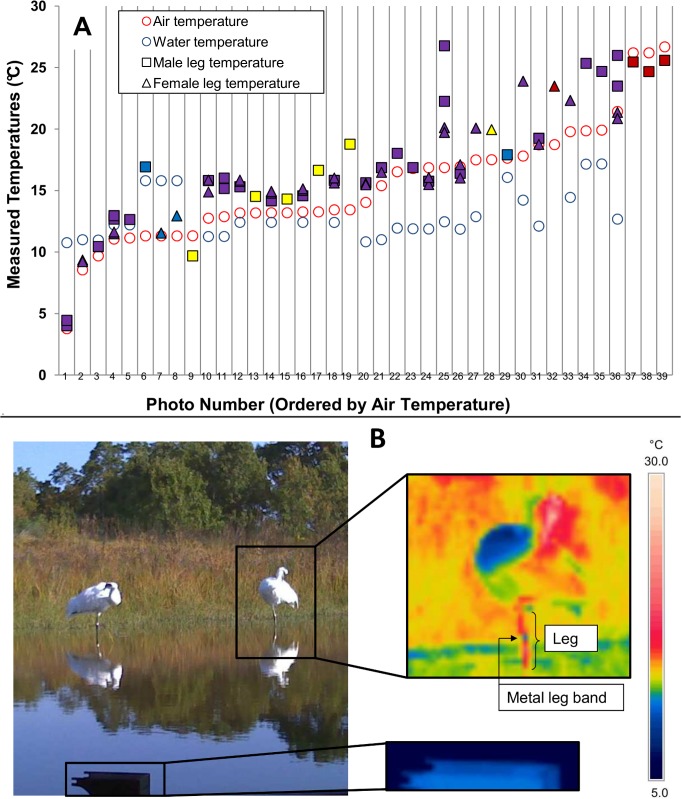
Fig 2. The average leg temperatures of two captive Whooping Cranes (one male, one female) measured from infrared photographs taken during a five-day period over which energy expenditure was measured.
(A) Average leg temperatures of the two Whooping Cranes in each thermal image, along with local air temperatures and pond water temperatures (for images in which birds were wading) at the time the image was captured. X-axis values are categorical, with each column in the chart representing data from a given image. Images were taken across four days at different times of day, but are arranged in order of increasing air temperature (from left to right) for clarity. Shapes of data points represent the individual on which the leg temperature was measured (square = male, triangle = female). Colors of data points represent whether the bird was wading and the portion of the leg visible to the camera. Purple points represent values from leg visible above the water surface when birds were wading in water of depth approximately half-way between the foot and tibiotarsal joint. Blue points represent values of the leg visible above the water surface in shallow water, with depth less than one-quarter of the distance between the bird’s foot and tibiotarsal joint. Yellow represents temperatures measured on a leg held above the water during periods when the bird was resting on the other leg, with values measured from the tibiotarsal joint to the foot (the only portion of the leg that was usually visible when birds rested in this position.) Red points represent measurements from the entire length of the leg when birds were not wading. One to four legs were measured per image, depending on the number of legs visible to the camera from the two individuals. Air temperatures were interpolated linearly to the minute from averages recorded every 15 minutes from a shaded thermocouple placed outside the crane enclosure at 2m height. Pond water temperatures were measured using a thermocouple placed at 30cm depth at the deep edge of the cranes’ wading pond. Temperatures at 30cm depth were very similar to temperatures at shallow depths (S2 Fig). (B) Portions of an infrared photograph from which Whooping Crane leg temperature was measured, including a Whooping Crane and the temperature reference plate (lower left; boxed digital image and zoomed is the IR view) used to calibrate the thermal image, along with a digital image taken simultaneously by the camera. The temperature scale is shown on the right. Fig 2 and all photographs therein are original to this study.

