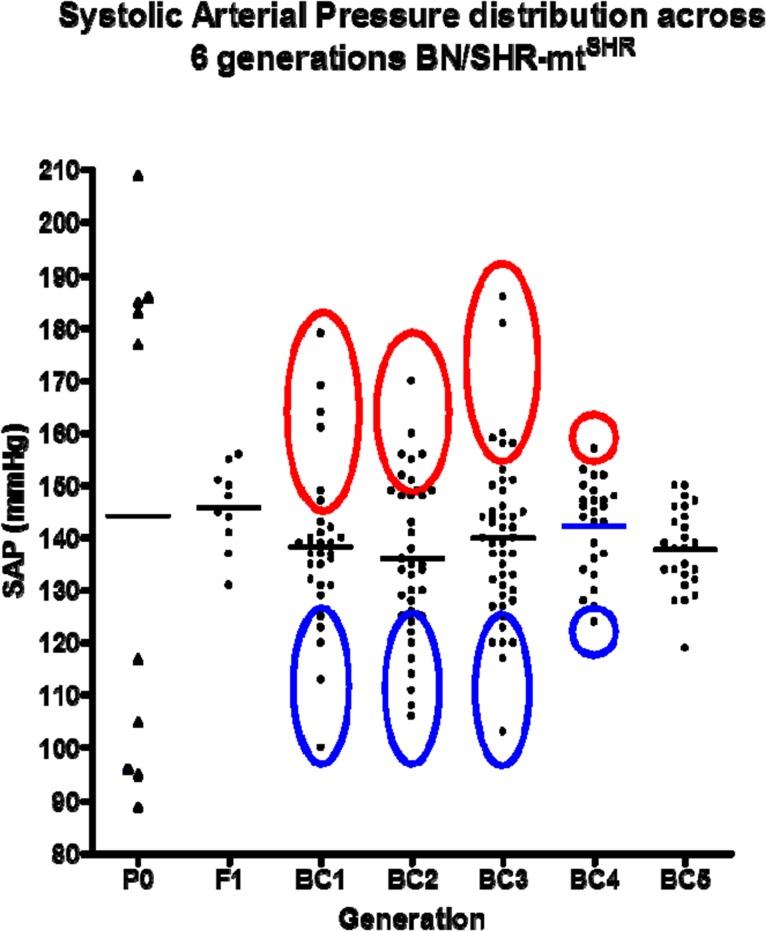
Fig 1. Six generations of BN/SHR-mtSHR rats with corresponding average systolic pressure (SAP) values.
Three distinct populations persisted throughout all 6 generations, with hypertension being dominantly expressed and maintained despite the reduction of the SHR nuclear genome. Tissues from HT animals used in all genome analysis experiments (both mitochondrial and nuclear) are indicated by the red circles. Tissues used from NT animals are indicated by the blue circles (adapted from Collett et. al.; 10).

