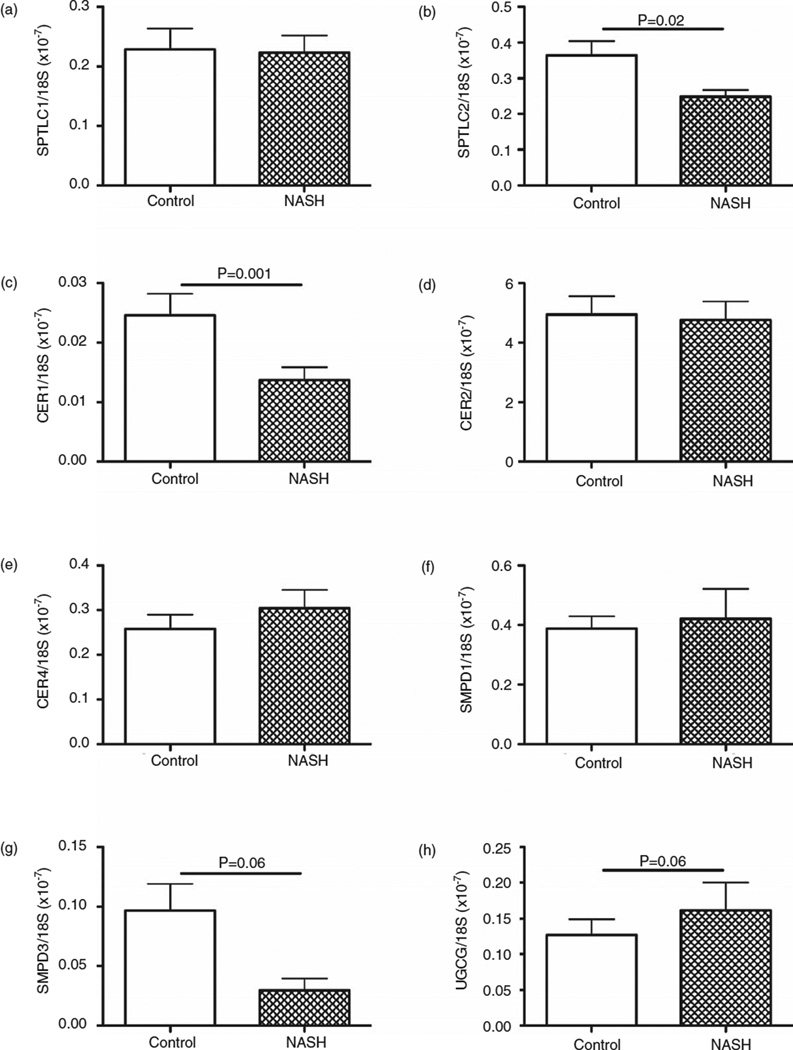
Figure 2.
Comparison of baseline ceramide-related gene expression in livers of non-alcoholic steatohepatitis (NASH) (n = 31) vs control (n = 10). Graphs depict mean ± standard error of the mean for (a) SPTLC1, (b) SPTLC2, (c) CER1, (d) CER2, (e) CER4, (f) SMPD-1, (g) SMPD-3, (h) UGCG. mRNA levels were normalized to 18S rRNA. CER, ceramide synthase; SMPD, sphingomyelin phosphodiesterase; SPTLC, serine palmitoyltransferase; UGCG, uridine diphosphate glucose ceramide glucosyltransferase.

