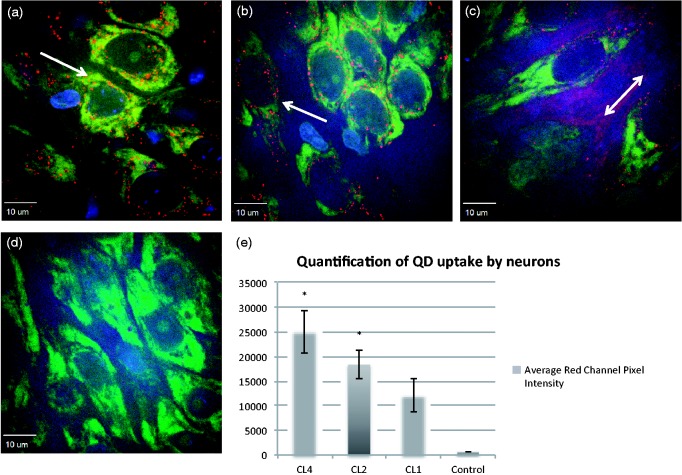
Figure 2.
Compact ligand uptake in hippocampus. Uptake of CL4 (a), CL2 (b), and CL1 (c) by organotypic hippocampal cultures after 24-hr incubation. (a) CL4 shows robust neuronal specificity (CA3 region of the hippocampus) and no background fluorescence as we have shown previously. (b) CL2 coating shows significantly more neuronal specificity than CL1 (c) that shows less neuronal uptake as well as extensive extracellular staining, similar to our previously reported data for PEG (Walters et al., 2012). (d) Control Nissl stain without QDs. (e) Histogram showing average red channel pixel intensity for neuronal cell bodies. CL4 and CL2 are significantly more expressed in neurons than CL1 as shown by a Student’s independent t test (p ≤ .005). Red is QD, green is Nissl staining, and blue is DAPI. Arrows indicate regions of high QD expression. CL = compact ligand; QDs = quantum dots; PEG = polyethylene glycol.

