
Figure 4.
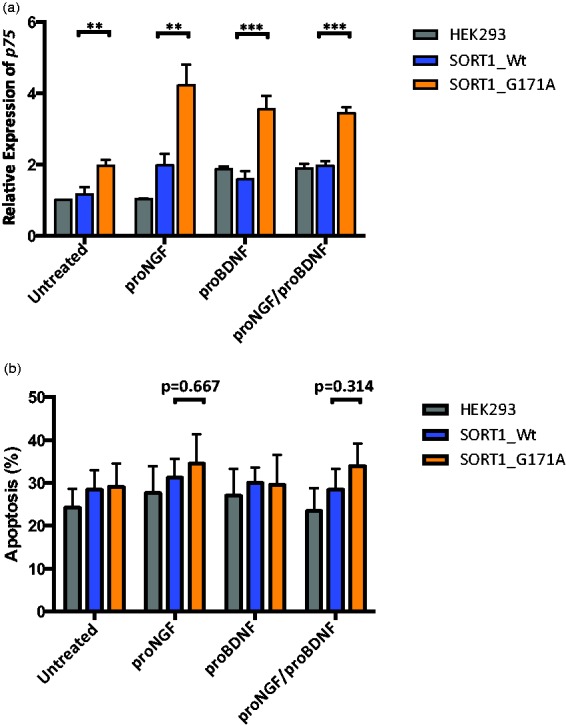
P75NTR mRNA expression and apoptotic cell death levels in wild-type and mutant SORT1 cells. Gray columns represent untrasfected HEK293 cells, blue columns HEK293 cells transfected with SORT1 wild-type plasmid, and orange columns HEK293 cells transfected with SORT1 mutant plasmid. (a) Relative quantification of p75NTR mRNA expression in untransfected and transfected HEK293 cells with either wild-type or mutant SORT1 alleles. The y-axis shows the relative expression of the target gene (P75NTR) relative to the internal control gene (B2M) and the x-axis shows treated and untreated cells with different proNTs (10 ng/ml). (b) Percentage of apoptosis in untransfected and transfected wild-type and mutant SORT1 cells. The y-axis shows the percentage of cells in early apoptosis and the x-axis represents different proNT treatments. ***p < .01, **p < .05.