
Figure 5.
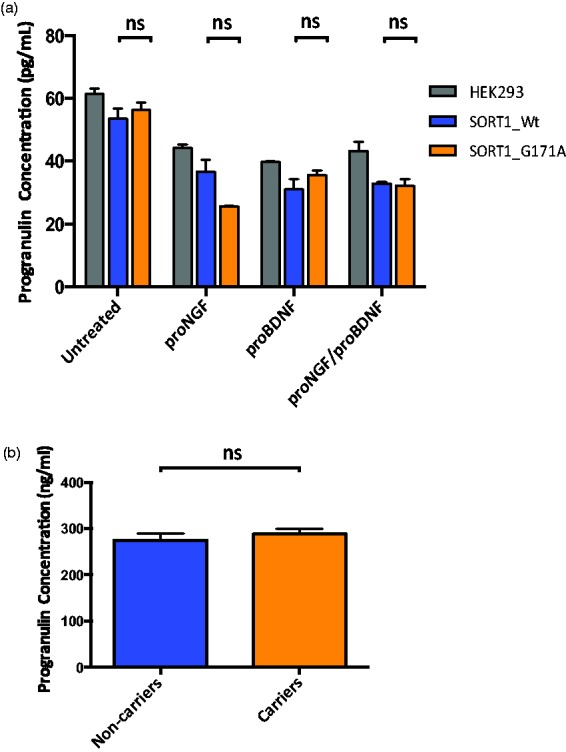
Progranulin expression in HEK293 cells and human serum samples. (a) PGRN levels in cells. Gray columns represent untransfected HEK293 cells, blue columns HEK293 cells transfected with SORT1 wild-type plasmid, and orange columns HEK293 cells transfected with SORT1 mutant plasmid. Values on the graph represent the mean ± SEM of three independent experiments. (b) PGRN levels in human serum. The blue column represents PGRN levels for SORT1 p.G171A noncarriers while the orange column is shown PGRN levels for p.G171A carriers. Values on the graph represent the mean ± SEM of duplicate samples from each individual. Statistical analysis was done with GraphPad software. Non-parametric Mann-Whitney test were performed. ns = non significant.