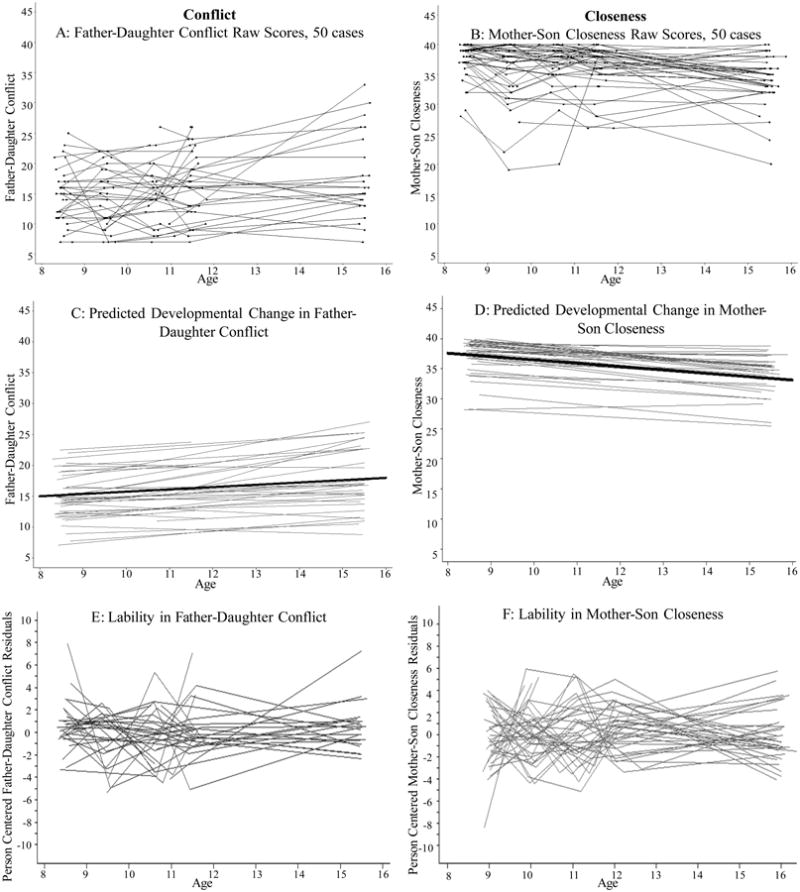
Figure 1.

Model-Fitting Results for Conflict and Closeness. Panels A and B depict raw data for a subset of the sample for father-daughter conflict (A) and mother-son closeness (B), exemplifying conflict and closeness across dyads. Panels C and D depict fitted curves for developmental change in conflict (C) and closeness (D) for the same subset. Solid gray lines depict the predicted curves for the subset of individuals, and bold curves show the small but significant sample average increase in conflict (C) and decrease in closeness (D). Panels E and F depict the lability (residual variance) in conflict (E) and closeness (F) for the same subset.
