
Fig. 4.
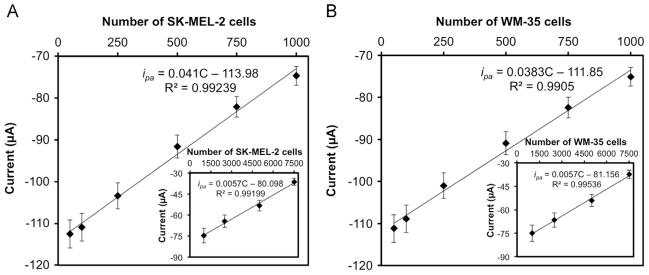
Linear calibration plots of anodic peak current obtained from CV vs. 50–1000 cells/2.5 mL of (A) SK-MEL-2 cells and (B) WM-35 cells (Insets in A and B are responses for 1000 to 7500 cells). Error bars represent standard deviations of three independent measurements under optimal experimental conditions.