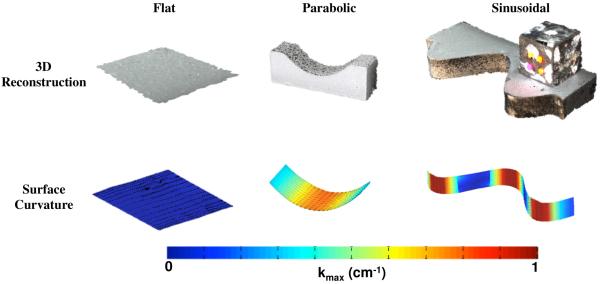
Fig. 6.
Validation of the experimental methods with various surfaces of known curvature. The top row depicts the reconstructed surface models exported from Photoscan Pro for flat, parabolic, and sinusoidal geometries. The bottom row displays the computed |kmax| for each surface. Regions of low curvature (flat) are represented by cool colors, while the warm colors signify surfaces of high curvature. kmax values are in units of cm−1.

