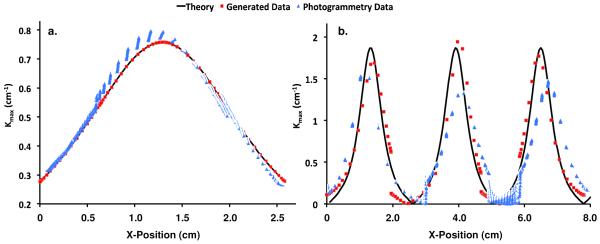
Fig. 9.

Validation results from surfaces of known curvature. The solid black line represents the theoretical curvature for the test parabolic surface (a) and the test sinusoidal surface (b). The red square markers represent the predicted |kmax| values along the x-axis using generated surface data, while the blue triangles represent the predicted |kmax| values using data from photogrammetric reconstructions.
