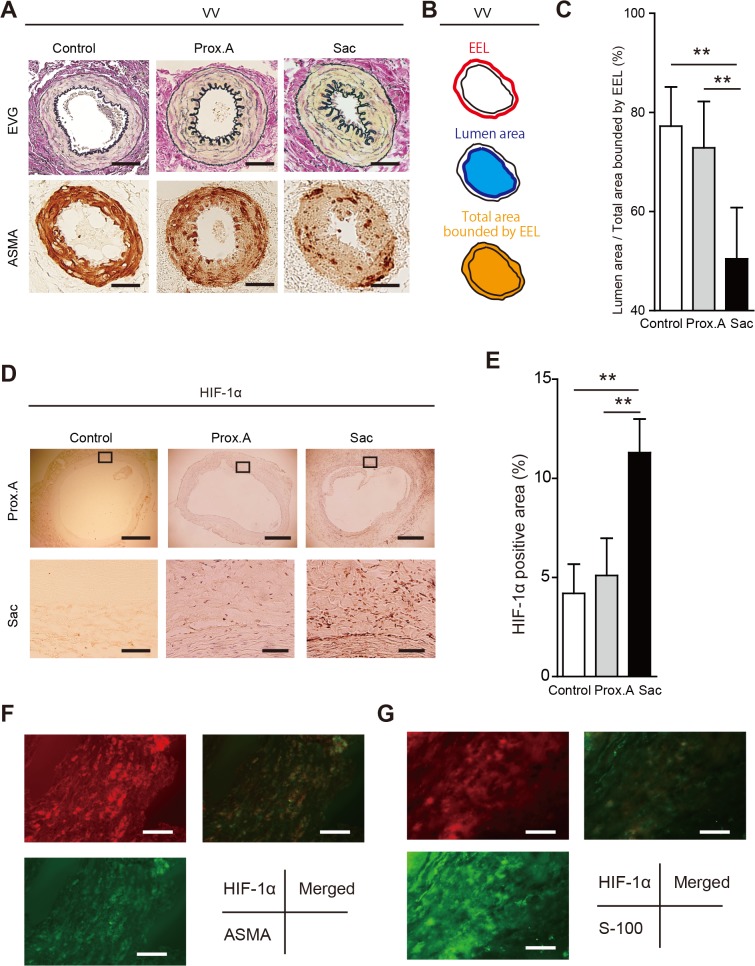
Fig 8. Tissue ischemia and hypoxia in aortic aneurysms induced by a polyurethane catheter insertion and aorta ligation in rats (group IV).
Data were collected using aortic specimens recovered at postoperative day 28 (n = 10). The specimens included group I (Control), infra-renal proximal aorta specimens (Prox.A) and aneurysmal sac specimens (Sac). All data are expressed as means ± standard deviation. (A) Representative adventitial vasa vasorum (VV) with Elastica van Gieson (EVG) staining and alpha-smooth muscle cell actin (ASMA) staining in Prox.A and Sac. Scale bar = 10 μm. (B) Schematic of the measurement method for lumen patency of VV. (C) Lumen patency of VV was measured as the ratio of lumen area to the total area of the VV which was bound by the external elastic lamina (EEL) in each VV. Comparison of the lumen patency of VV between Prox. A and Sac showed significant stenosis in Sac VV. Results are means ± standard deviation of six independent experiments. (D) Immunohistochemistry for HIF-1α in Control, Prox. A, and Sac. The squared area in the upper panels is magnified in lower panels. Scale bar in upper panels = 500 μm, in lower panels = 100 μm. (E) HIF-1α-positive areas were counted per aortic section (n = 10, each group). Results are means ± standard deviation of six independent experiments. Statistical analysis was performed using analysis of variance for comparisons among the three groups. Post-hoc comparison was performed using Tukey’s test. **P<0.01 indicates a statistically significant difference. (F) Representative images of immunofluorescence staining for smooth muscle cells (SMCs; alpha-smooth muscle cell actin, ASMA; green) and HIF-1α (red). Merged images showed that HIF-1α was positive in the medial SMCs. Scale bar = 20 μm. (H) Representative images of immunofluorescence staining for fibroblasts (S-100) (green) and HIF-1α (red). Merged images showed that HIF-1α was positive in the adventitial fibroblasts. Scale bar = 20 μm.

