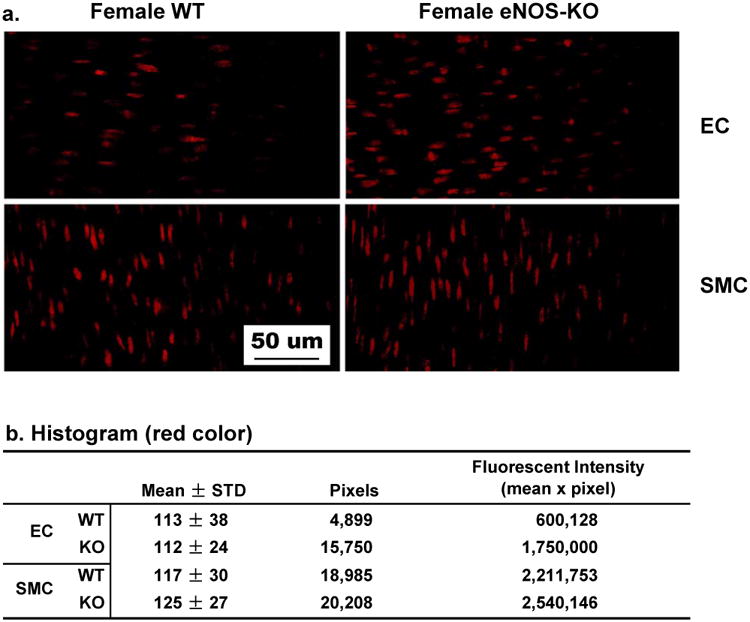
Figure 4.

Shear stress-stimulated superoxide formation in mesenteric arteries of female WT and eNOS-KO mice. The red color in the cells represents the level of superoxide. Endothelial cells (EC) are aligned horizontally and smooth muscle cells (SMC) aligned vertically (a). Panel b summaries histogram data of the four shown in panel a. Only red color was analyzed and the fluorescent intensity (corresponding to superoxide formation) was calculated as the product of the mean intensity and total red pixels. ,
