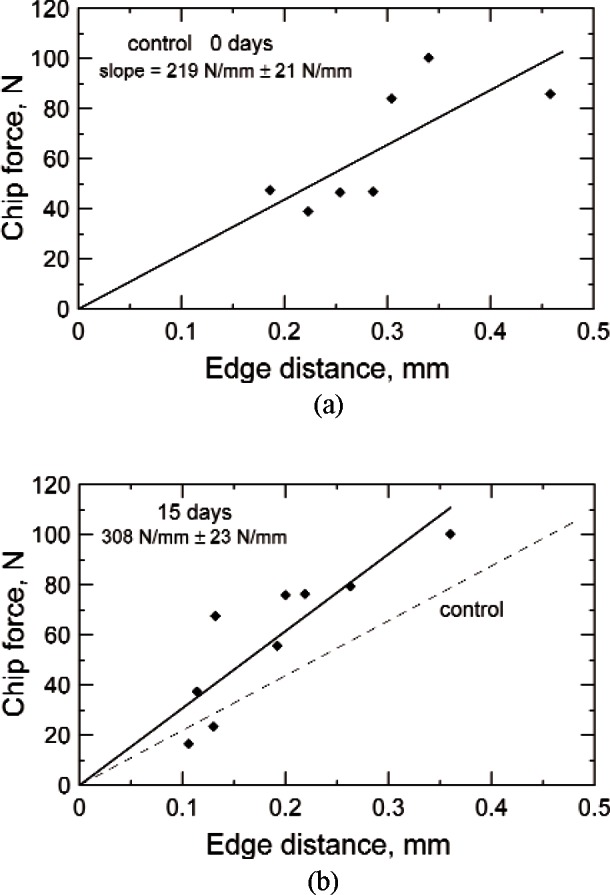
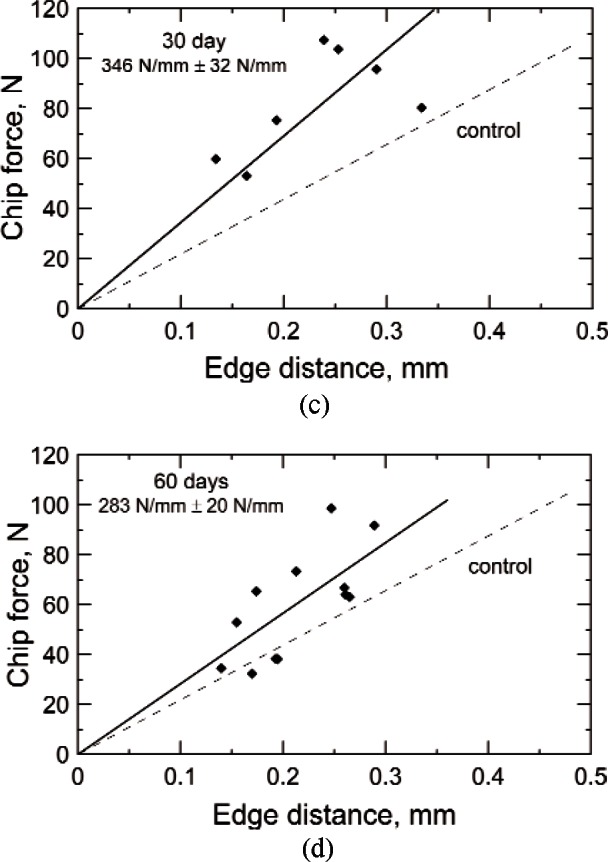
Fig. 4.


The edge toughness plots for groups 1–4 (a, b, c, d), edge chipped after (zero, 15, 30, and 60) d. Each line demonstrates notable scatter, but all show the trend of increased force required to produce larger chips. The dashed lines are the control data set for 0 d copied from (a). The uncertainties for the line slopes are ± one standard deviation.
