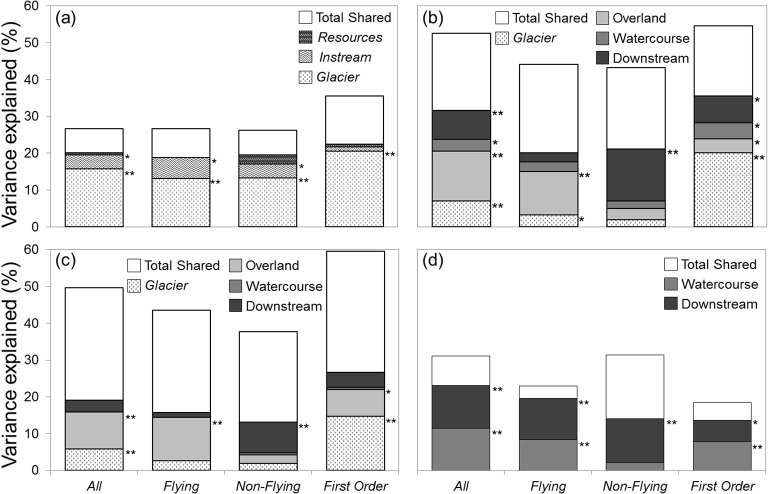
Fig 2. Results of variation partitioning analyses.
Results of analyses performed on (a) the two environmental components Instream and Resources and the component Glacier, (b) the three spatial eigenfunction-based variables computed using overland, watercourse, downstream geographical distances and the environmental component Glacier, (c) the three spatial eigenfunction-based variables computed using overland, watercourse, downstream altitudinal distances and the environmental component Glacier, and (d) the two spatial eigenfunction-based variables based on watercourse and downstream glaciality distances. All analyses were performed for the four taxon matrices (All taxa, Flying taxa, Non-flying taxa, and First-order taxa). Figure shows the amount of variation (%) in the structure community that is uniquely explained by each explanatory variable as well as the total shared variance (all the shared components between two, three and four explanatory variables). The level of significance is indicated next to the bars (** P < 0.01, * P < 0.05, see S3 Appendix for details).

