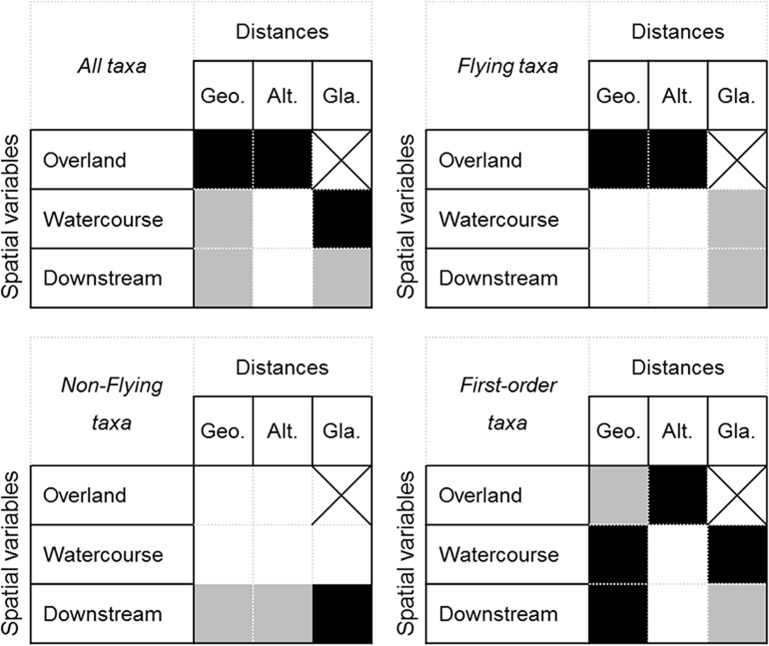
Fig 3. Summary of the results of variation partitioning analyses.
Illustrative figure indicating, for each spatial variable (overland, watercourse, and downstream) which distance type (geographical, Geo., altitudinal, Alt., and glaciality, Gla.) had a significant effect on community variation of All taxa, Flying taxa, Non-flying taxa, and First-order taxa. A black mark indicates that the corresponding distance had a unique significant effect on community variation, and that its effect was not confounded with others types of distance. A grey mark indicates that the corresponding distance had a unique significant effect on community variation, but that its effect was confounded with at least one of the others type of distance.

