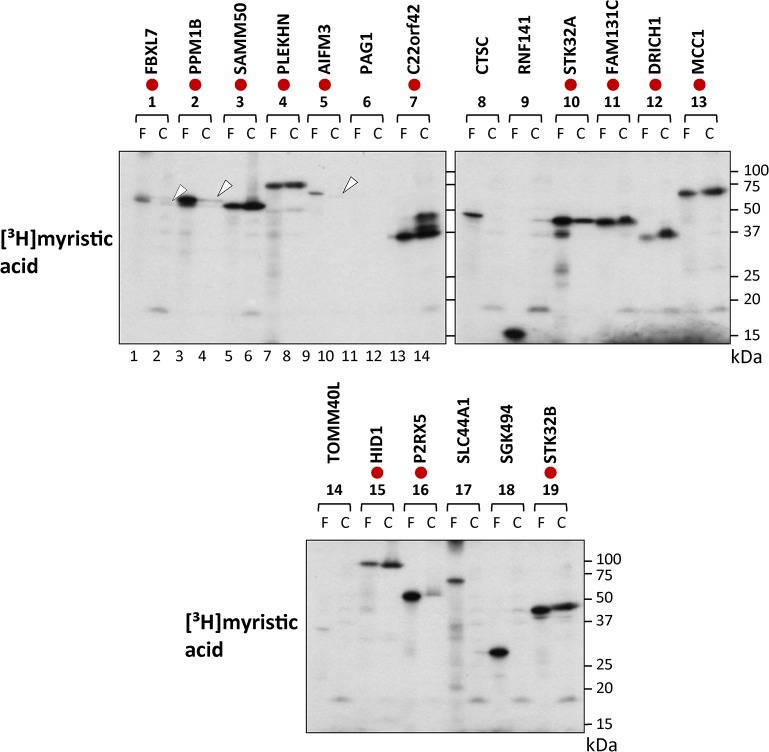
Fig 3. Comparison of the molecular size of [3H]myristic acid-labeled protein bands detected in transfected HEK293T cells with those detected in the insect cell-free protein synthesis system.
The molecular sizes of [3H]myristic acid-labeled protein bands expressed in the two expression systems were compared with each other by SDS-PAGE analysis. The samples in which similar molecular sizes were observed are indicated by red circles. Faint bands are indicated by arrowheads. F; insect cell-free, C; HEK293T cells.

