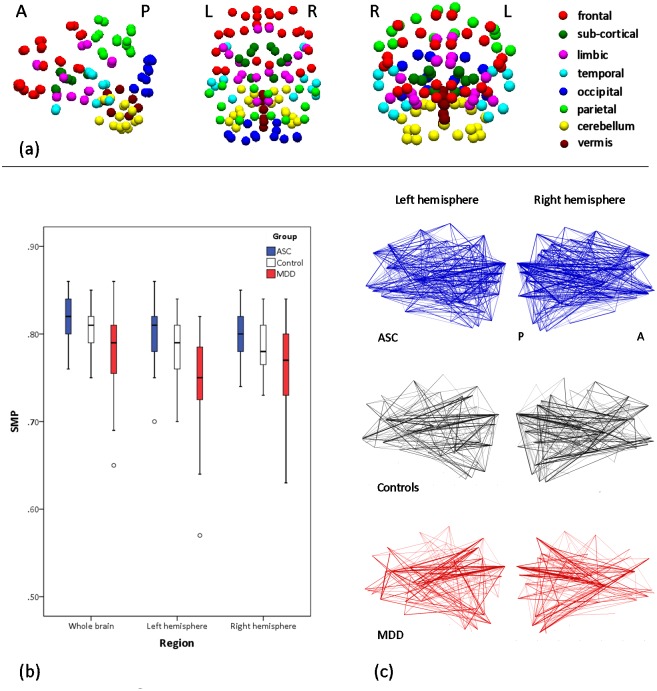
Fig 2. Semi-metric percentages and backbones.
(a) Sagittal, axial and coronal projections of nodes coloured according to the modules in which they are contained. (b) Between-group comparisons (patient groups relative to controls) for whole brain, left and right hemisphere SMP displayed as box-and-whisker plots identifying the median by the central line, the 25th and 75th percentile ranges by the limits of the box, and the minimum and maximum range (excluding outliers) by the limits of the whiskers. Outliers are individually displayed and defined as values >1.5 the interquartile range from the 25% and 75% quartiles. (c) Sagittal projections of the left and right hemispheres of the semi-metric backbones for each group. The thickness of the edges represents the percentage of participants within each group with a semi-metric edge at that location, with percentages > 90% omitted.

