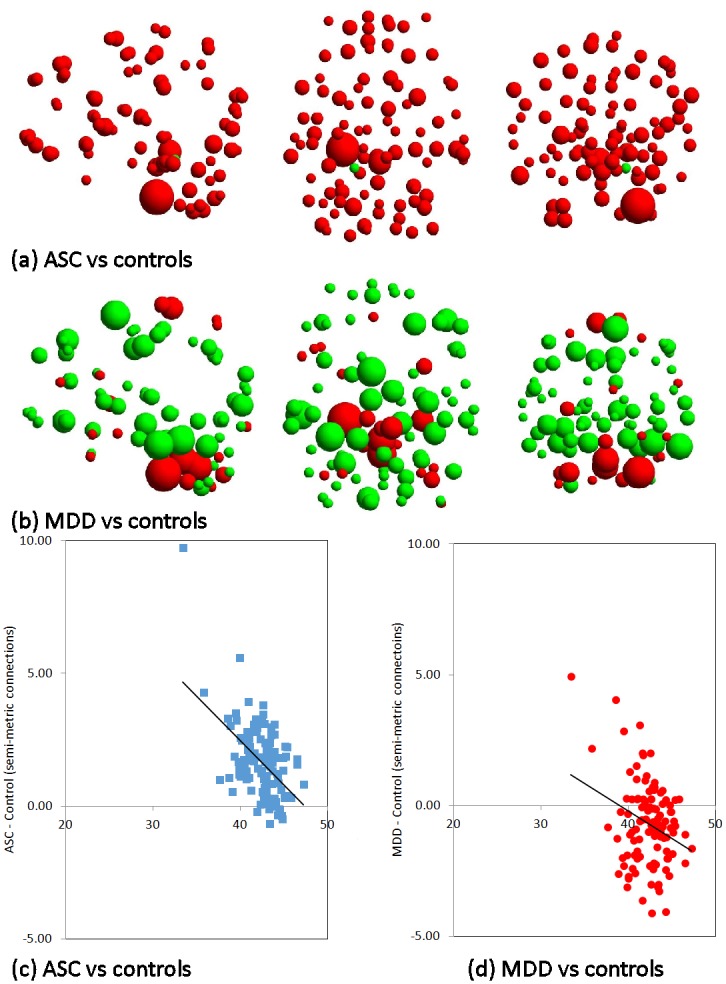
Fig 3. Node degree and node disruption indices.

Sagittal, axial and coronal projections (left-to-right) of nodes for comparisons of node degree in the semi-metric network for each between-group comparisons: (a) ASC vs. controls; (b) MDD vs controls. The radius of the node is proportional to the average degree difference and the colour denotes the direction of the effect; red indicating increases and green decreases, relative to controls. Plots of the difference in mean degree between (c) ASC and (d) MDD, and controls against mean degree for controls, for the semi-metric network. Node disruption indices are defined as the slope of the regression lines, plotted on each graph.
