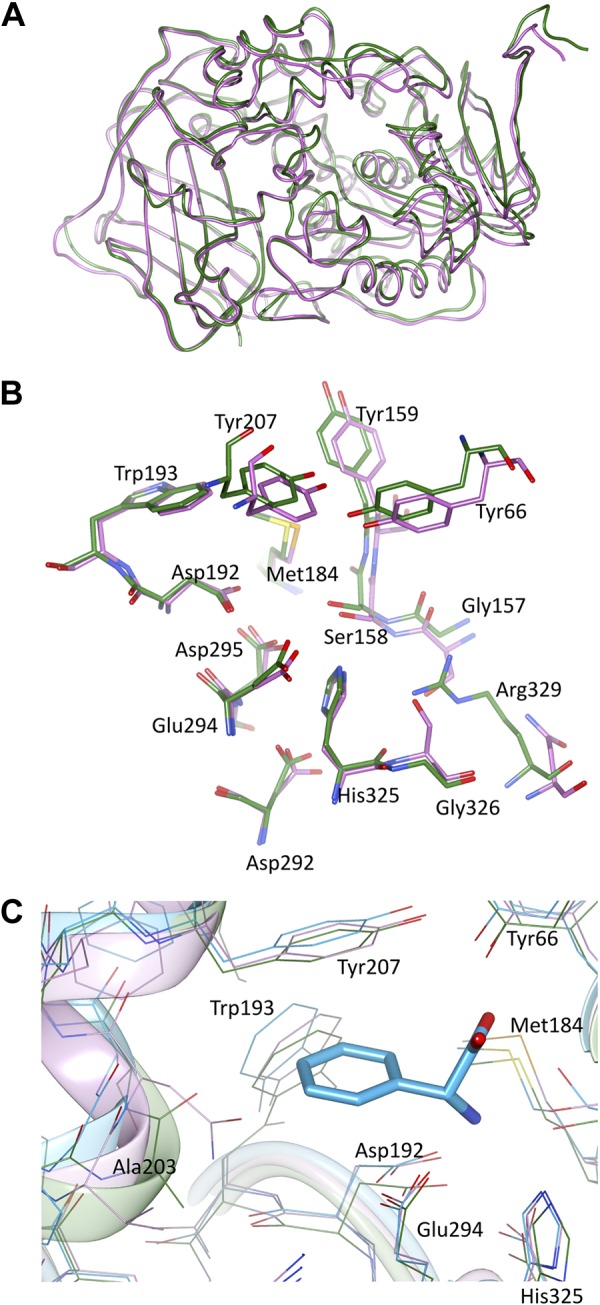
Figure 3.

Comparison of BAP and AEHs. A) Superposition of the BAP monomer (green; this work) with XcAEH (pink; PDB entry 1MPX). B) Superposition of active sites: BAP is in green, and XcAEH is shown in pink. C) Superposition of active sites: BAP is shown in green, XcAEH in pink, and AtAEH in blue (PDB entry 2B4K). For reference, the d-Phg ligand from the AtAEH structure is shown in a stick representation.
