Figure 5.
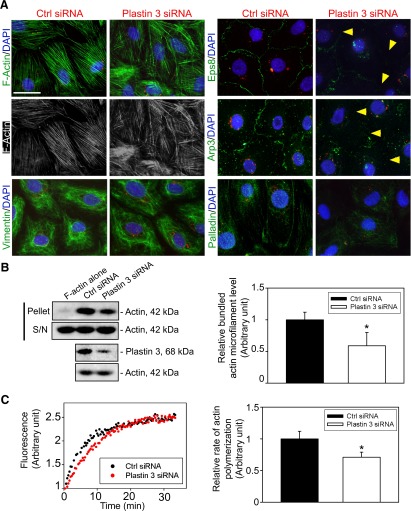
KD of plastin 3 leads to disorganization of actin microfilaments in Sertoli cells. A) Following the KD of plastin 3, the F-actin (green or gray) network in Sertoli cells became branched, truncated, and intersected with each other, illustrating a reduced bundling capability, and the vimentin-based intermediate filaments were mostly unaffected. These changes in actin microfilament organization following plastin 3 KD also associated with a mislocalization of actin barbed end capping and bundling protein Eps8, branched actin polymerization protein Arp3, and actin-bundling protein palladin. For instance, both Eps8 and Arp3 were not found at the Sertoli cell-cell interface (see yellow arrowheads). B) A study by biochemical assay to assess actin-bundling activity illustrated that the KD of plastin 3 led to a reduced actin-bundling capability (left panel). Pellet contained bundled F-actin, whereas supernatant (S/N) contained single unbundled actin microfilaments (see Materials and Methods for details). Each bar in the histogram (right panel) is a mean ± sd of 4 experiments. *P < 0.05. C) A KD of plastin 3 by RNAi also perturbed the kinetics of actin polymerization (left panel) in Sertoli cells. In brief, Sertoli cells (0.4 × 10⁶ cells/cm2) cultured for 3 d were transfected with corresponding siRNA duplexes for 24 h. Thereafter, siRNA duplexes were removed, and Sertoli cells were cultured alone in fresh F12/DMEM for another 24 h and harvested on d 5 to obtain lysates and subjected to a fluorometric-based actin polymerization assay, in which the polymerization of pyrene-labeled actin was monitored by enhanced fluorescence emission at 395–440 nm over a 35-min period. The relative rate of actin polymerization (right panel) (i.e., increase in fluorescence intensity over time) during the initial linear phase in the first 12 min based on the kinetics data shown on the left panel was estimated by linear regression. The rate of actin polymerization of control cells (transfected with nontargeting negative control duplexes) was arbitrarily set as 1. This experiment was repeated 4 times and yielded similar results. Each bar in the histogram is a mean ± sd of 4 experiments. *P < 0.05.

