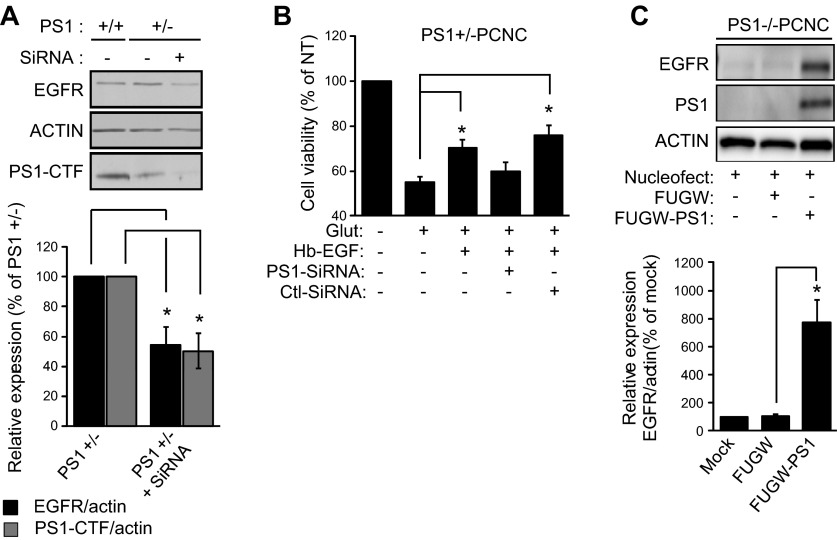
Figure 4.
Acute knockdown of PS1 decreases EGFR and abolishes EGF neuroprotection while reintroduction of PS1 in PS1−/− neurons increases EGFR. A) (Top) PCNC from PS1 heterozygous KO (+/−) were cultured in 12-well plates and at 5 DIV were treated with 1 μM Accell Smartpool siRNA against PS1 for 72 h. Nontreated cultures were used as controls. After incubation, lysates were collected and assayed by WBs for the indicated proteins. WT neurons (+/+) were also included as control. (Bottom) Densitometric analysis of the relative amounts of EGFR and PS1–C-terminal fragment in PCNC is expressed as ratio to actin, then normalized as a percentage of EGFR or PS1–C-terminal fragment amount in the nontreated WT neurons. Data were respectively obtained from 4 separate experiments. *P < 0.05 (paired Student’s t test). No effect was observed on PS1 when neurons were treated with 1 μM Accell Smartpool scramble siRNA for 72 h (data not shown). B) PS1+/− PCNC were grown in 24-well plates with Neurobasal medium plus B27 supplement. At 5 DIV neurons were treated with 1 μM Accell Smartpool siRNA for 72 h and then incubated with 20 ng/ml Hb-EGF overnight. The next day, the medium was switched to HBSS containing Hb-EGF for 30 min, followed by 50 μM glutamate incubation for 3 h. Cell viability was evaluated by MTT assay and normalized to nontreated cells. Results (means ± sem) were summarized from 6 independent experiments; in each experiment, each condition is the average of 4 identical wells. *P < 0.05 comparing between cultures treated with glutamate in the presence or absence of Hb-EGF, PS1-SiRNA, or nontargeting siRNA (paired t test). C) (Top) PS1−/− PCNC were mock transfected (left lane) or transfected with either mouse PS1 in FUGW vector or vector alone. After incubation, lysates were collected at 8 DIV and assayed on WBs for the indicated proteins. (Bottom) Densitometric analysis of the amounts of EGFR in transfected PS1−/− neuronal cultures above is expressed as ratio of EGFR to actin and normalized to mock nucleofected neurons. Bars represent mean and error bars sem. Data were obtained from 4 independent experiments. *P < 0.05 (paired Student’s t test).

