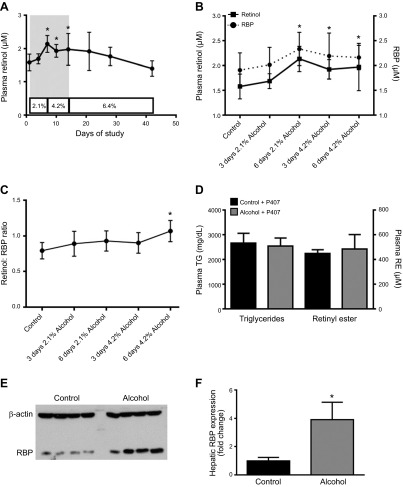
Figure 4.
A) Circulating levels of retinol and RBP and hepatic RBP expression transiently increased in alcohol-fed mice during the alcohol-adaptation period but returned to baseline levels with continuing alcohol consumption (control n = 26; 3 d 2.1% alcohol, n = 5; 6 d 2.1% alcohol, and 3 d 4.2% alcohol, n = 12; 6 d 4.2% alcohol, n = 14; 7 d 6.4% alcohol, n = 7; 14 d 6.4% alcohol, n = 11; and 21 d 6.4% alcohol, n = 5). The gray shaded area in (A) is expanded in (B) and plotted along with plasma RBP levels, showing that there was a parallel increase in plasma RBP (n = 6–12) and retinol during this period. C) The molar ratio of retinol to RBP, demonstrating a trend for increased RBP saturation during the alcohol-adaptation period (n = 6–12). D) Injection of unfed WT mice (n = 6–7) with the lipase inhibitor P407 elevated plasma triglyceride (TG) and retinyl ester (RE) levels equally in control and alcohol-fed mice. E) Representative Western blot of hepatic RBP expression for control and alcohol-consuming mice. F) Densitometric analysis of hepatic RBP expression revealed that this protein increased significantly during the alcohol-adaptation period, relative to its level in control mice (n = 4). A–C) *P < 0.05, retinol vs. d 0; #P < 0.05, RBP vs. d 0; 1-way ANOVA. F) *P < 0.05 vs. control; Student’s t test.

