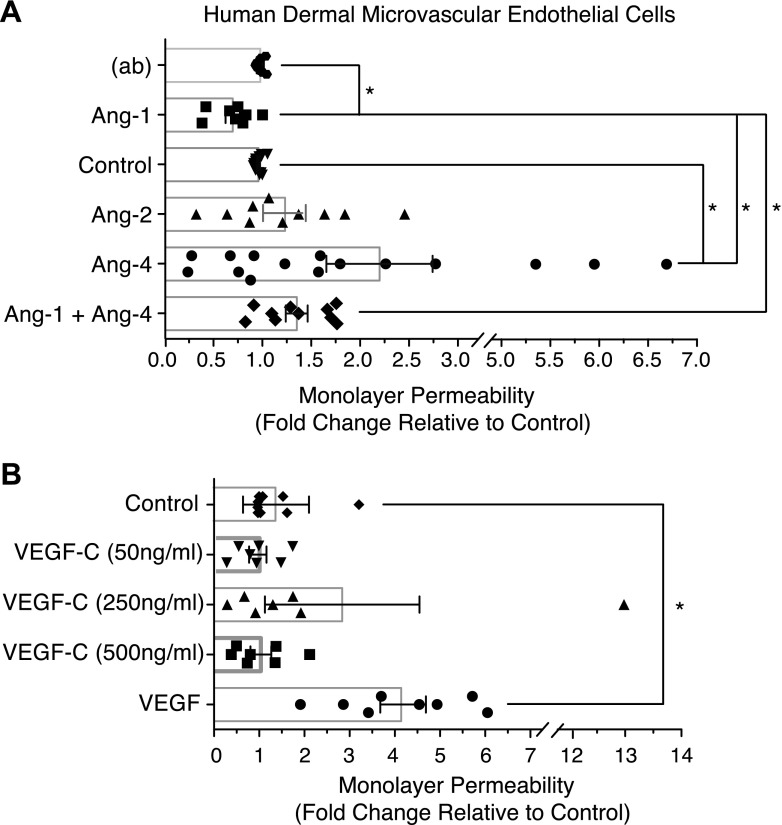
Figure 5.
Ang-4 and BEC permeability. BECs were seeded for permeability measurements as described in Fig. 4. Cells were treated with 100 ng/ml VEGF, 0.4 µg/ml Angs, or indicated concentrations of VEGF-C. Graphs represent the mean fold change relative to control from 7–10 combined experiments. Statistical analysis was performed using 1-way ANOVA and Tukey’s HSD post hoc test. (ab), antibody used to precluster Ang-1. *P < 0.05.

